We no longer support this browser. Using a supported browser will provide a better experience.
Please update your browser.
On January 21, 2020 the first case of COVID-19 was diagnosed in Washington state. By May 23, 2020, the case load across the U.S. had grown to over 1.6 million people with nearly 100,000 fatalities. As the virus spread, businesses across the country shuttered their doors to slow contagion, leading to widespread job loss. Over the six week period between March 14 and May 9, over 33.6 million people filed initial unemployment claims. In the midst of economic calamity, policy leaders at all levels have struggled to understand the scale and scope of the economic shock rippling through the economy. At the federal level, Congress mobilized the largest economic stimulus effort in history, directing trillions of dollars in financial assistance to individuals and businesses. At such great cost, it is imperative this assistance reaches those most in need.
The aim of this research is to use JPMorgan Chase Institute data to understand the impact of the pandemic on the supply and demand of local commerce across U.S. cities.1 While the scope of the pandemic is global, we experience the impacts locally. Consumers need to be able to acquire critical goods and services where they live. Producers need to be able to service a stable set of consumers, most often those in the same community. Therefore, to understand the strain placed on the local economic ecosystem requires a place-based view of local commercial activity that characterizes the everyday interplay between consumers and producers in a community.
To bring this interplay into focus, we construct a “local commerce" economic view using a subset of credit card transactions that typify everyday goods and services transacted between local buyers and sellers. This local commerce view differs from other publicly available series because it includes a broader set of goods and services to reflect the modern, more service-based economy.2 We further restrict to such goods and services that are well represented by card transactions. Such representation is important in studying consumer substitution patterns, such as toward online goods and services. Using these conditions, we define local commerce (LC) to include the following goods and services: clothing, grocery, fuel, general goods, home maintenance goods and services, local leisure goods and services related to arts and sporting activities, pharmacy, personal care and professional consumer services, restaurants, and local private and public ground transportation.3 4
The following analysis of LC relies on approximately 450 million credit card transactions per month made by a rolling sample of 11 million customer accounts.5 6 The richness of these transaction-level data allows us to couple attributes of the consumer with those of the establishment at which the purchase was made. This includes information on the distance between the consumer’s residence and the establishment’s location.7 These transactions have broad geographic coverage, but we focus on sixteen cities with a sufficient number of observations to allow for further detailed analysis at the neighborhood level. After this initial analysis is published, we plan to release a set of online companion resources that enable national and local public policy officials to track the performance of local commerce going forward.
We document a number of striking features from our initial analysis. Across the sixteen cities we profile, we measure a 12.8 percent decline in year-over-year growth in LC spend in March 2020.8 We also find wide variation in spend growth between and within cities and online versus offline. LC spend across the sixteen cities sharply declined in March, regardless of local lockdown or COVID-19 outbreak severity, with declines ranging from 2.8 percent (Phoenix) to 16.6 percent (San Francisco). Within and across cities, LC spend declines were relatively uniform across neighborhoods featuring a wide range of household median income. However, a disproportionate share of low-income neighborhoods experienced extreme negative spend declines. Consumers shifted their share of LC spend online by 4.6 percentage points, such that online growth in LC spend was still positive, but just 1.5 percent. In March, only grocery and pharmacy spend grew relative to the previous year, with extraordinary rates of growth online.
In this initial piece, we provide further detail on changes in spend in consumer food categories: groceries and restaurants. At a high level, in March 2020, overall spend on food decreased between 5.0 percent for the lowest-income and 8.4 percent for the fourth-highest-income quintiles. Unsurprisingly, within food, consumers shifted much of their spend toward grocery and away from restaurants. We find proportional changes in food spend allocated to groceries versus restaurants to be relatively even across neighborhoods of all income levels in March 2020. However, neighborhoods with the lowest increases in online grocery spend are more likely to be low-income. Consumers in low-income neighborhoods also tend to live farther from the grocery stores at which they shop. Coupling both disadvantages suggests that despite similarity in overall spend patterns on food, consumers living in low-income neighborhoods may be more at risk for COVID-19 when acquiring groceries.
The pandemic created severe supply and demand shocks. Many producers are shutdown or serving consumers at a distance, while simultaneously incorporating social distancing guidelines into their production processes. At the same time, consumers have less income to spend on average and are less inclined to physically patronize businesses for fear of contagion. As a consequence, consumers in our cities decreased LC spend by 12.8 percent between March 2019 and March 2020.
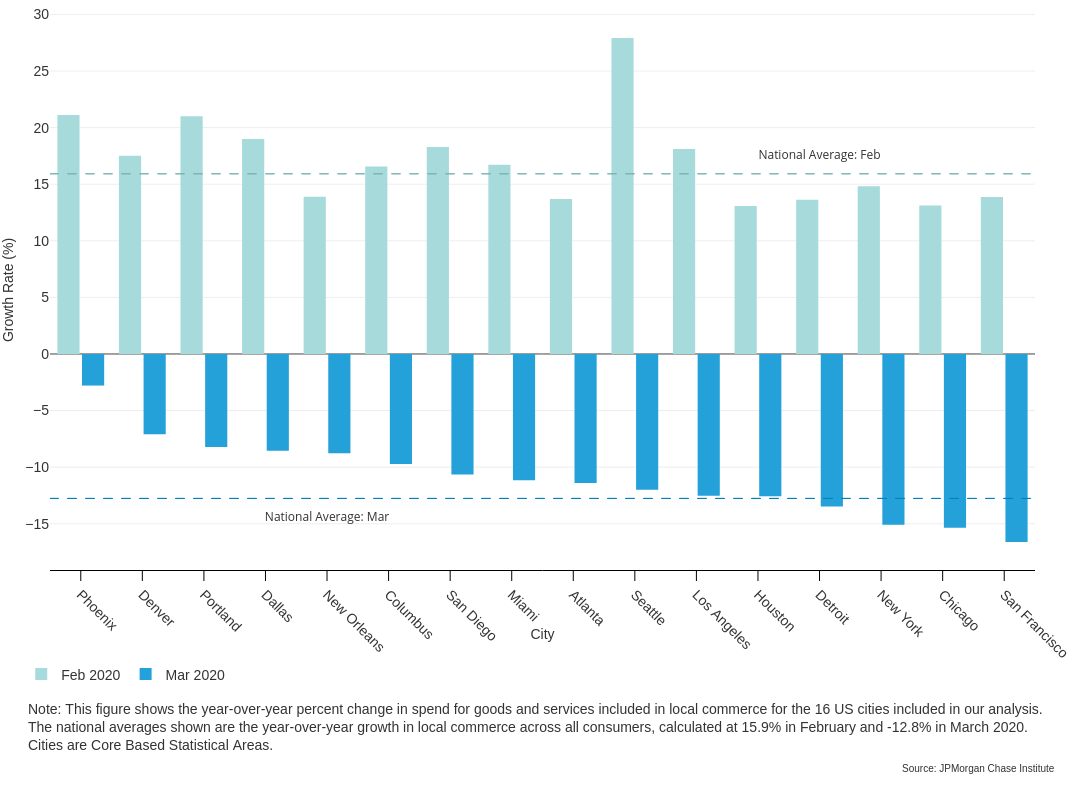
Figure 1 - San Francisco, Chicago, New York, and Detroit experienced the sharpest declines in local commerce spend
As seen in Figure 1, all sixteen cities enjoyed robust LC growth in February 2020; by March, all experienced significant declines. The heaviest decline was in San Francisco (16.6 percent), the first city with a stay-at-home order starting on March 17. The next heaviest declines were in Chicago, New York, and Detroit: three major cities which, along with New Orleans, have the highest COVID-19 case rates to date. Even cities with limited outbreaks in March experienced high declines.9 The best performing city in our analysis was Phoenix, where consumer spend still decreased by 2.8 percent. These results show that, even though the onset of COVID-19 occurred at different times for different cities, consumers across cities pulled back their spend in a narrow time window. The correlated response suggests that consumer sentiment and policy interventions during the pandemic can drive growth outcomes.
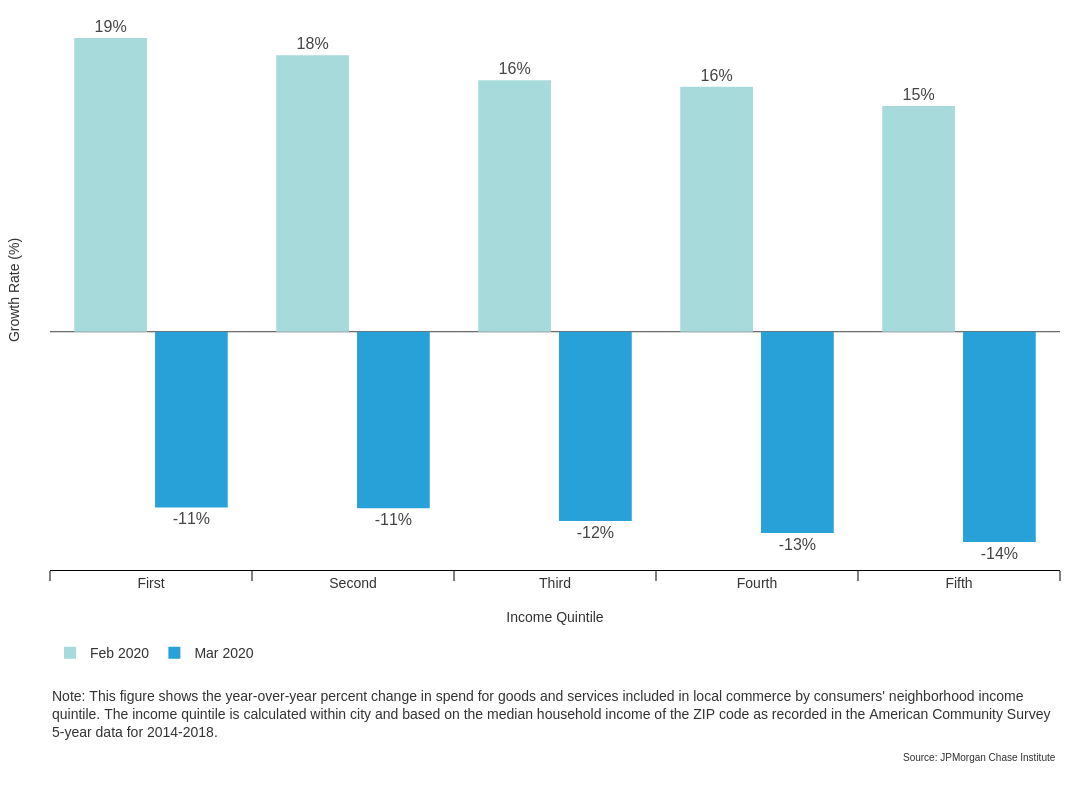
Figure 2- Local commerce spend declines were higher for consumers in high-income neighborhoods
While these high-level results inform the scale of the current economic crises across the U.S., policy makers can better direct aid to those most in need with information on how the pandemic is impacting neighborhoods of differing socioeconomic status. To aid this effort, we provide analysis across neighborhoods by neighborhood income. Throughout the analysis, we use ZIP codes as proxies for neighborhoods. Within each city, we separate neighborhoods into neighborhood income quintiles by city using the neighborhood’s median household income as reported in the American Community Survey 5-year data for 2014-2018. Figure 2 shows that all consumers across neighborhood income quintiles increased LC spend in February, and then decreased LC spend in March. High-income neighborhoods experienced the largest contraction in March 2020 at -13.6 percent.
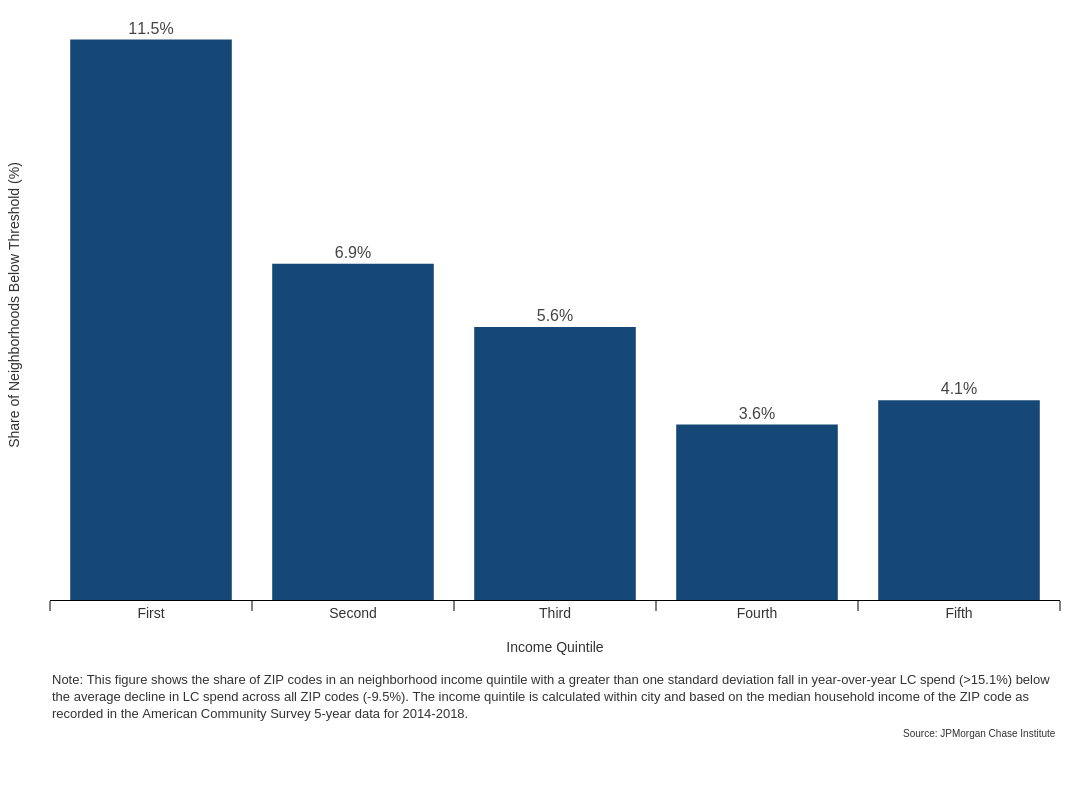
Figure 3 - 11.5 percent of low-income neighborhoods experienced severe spending declines
Despite the relative similarity in neighborhood LC spend growth in each quintile, we find that low-income neighborhoods experienced a disproportionate share of extreme spend declines. We define a severe spend decline as a drop of more than one standard deviation (15.1 percent) below the average drop across all neighborhoods (-9.5 percent).10 As can be seen in Figure 3, 11.5 percent of the lowest-income neighborhoods, and 6.9 percent of the neighborhoods in the next highest quintile, are in the severe spend decline category. The fact that low-income neighborhoods were more likely to experience severe declines while high-income neighborhoods had the largest average decline may be a result of differences in the choices available to residents. For example, low-income neighborhoods may be more exposed to job losses while high-income neighborhoods are able to decrease a large share of discretionary spend. We unpack more of the differences across neighborhood income in later sections.
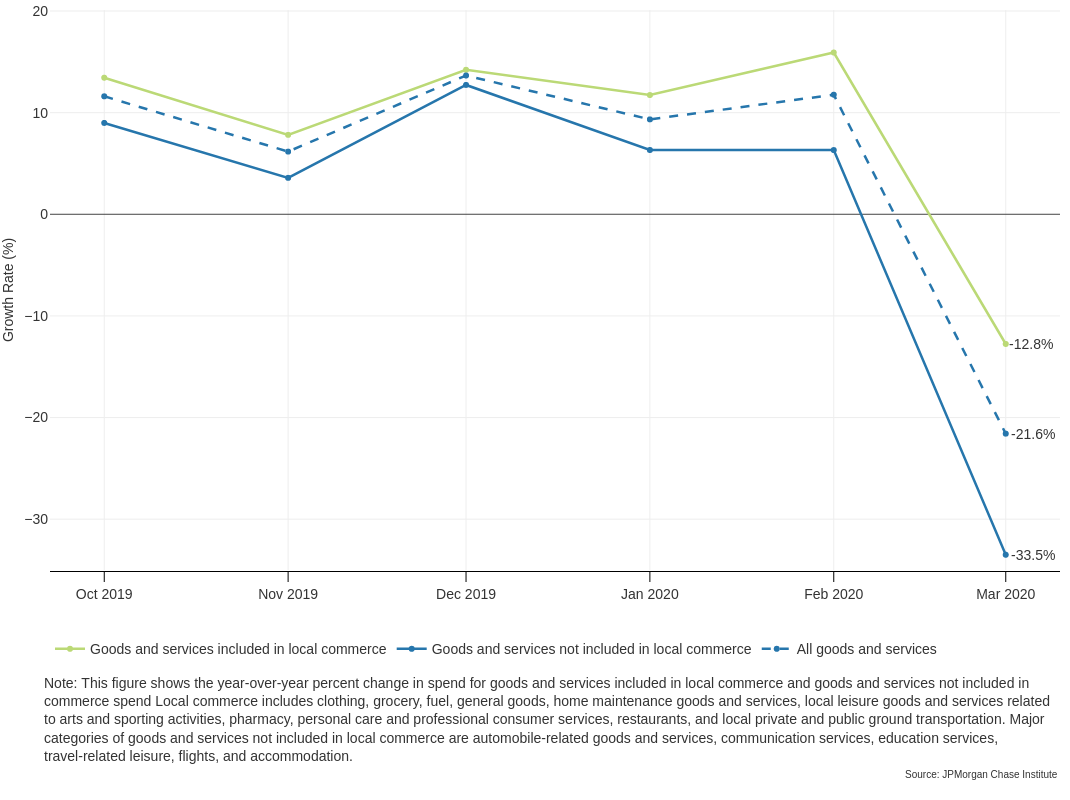
Before further decomposing LC spend changes, we show that LC spend has been more resistant to spend declines than goods and services not included in LC spend. As Figure 4 shows, we find that consumers in our sample responded to the pandemic in March by decreasing their overall spend on goods and services on credit cards by 21.6 percent. This is an alarming figure for the U.S. economy, in which consumer spend accounts for almost 70 percent of Gross Domestic Product.11 Local economies experienced a material contraction overall, but the spending reductions were greater for goods and services consumed primarily away from home. The gap between LC spend growth and non-LC spend growth widened from January to February, with the greatest gap in March. The consistently higher growth in LC spend implies that the LC share of total spend increased as the pandemic worsened. In order to better understand the local economic conditions across the U.S., we focus on LC spend for the remainder of the analysis.
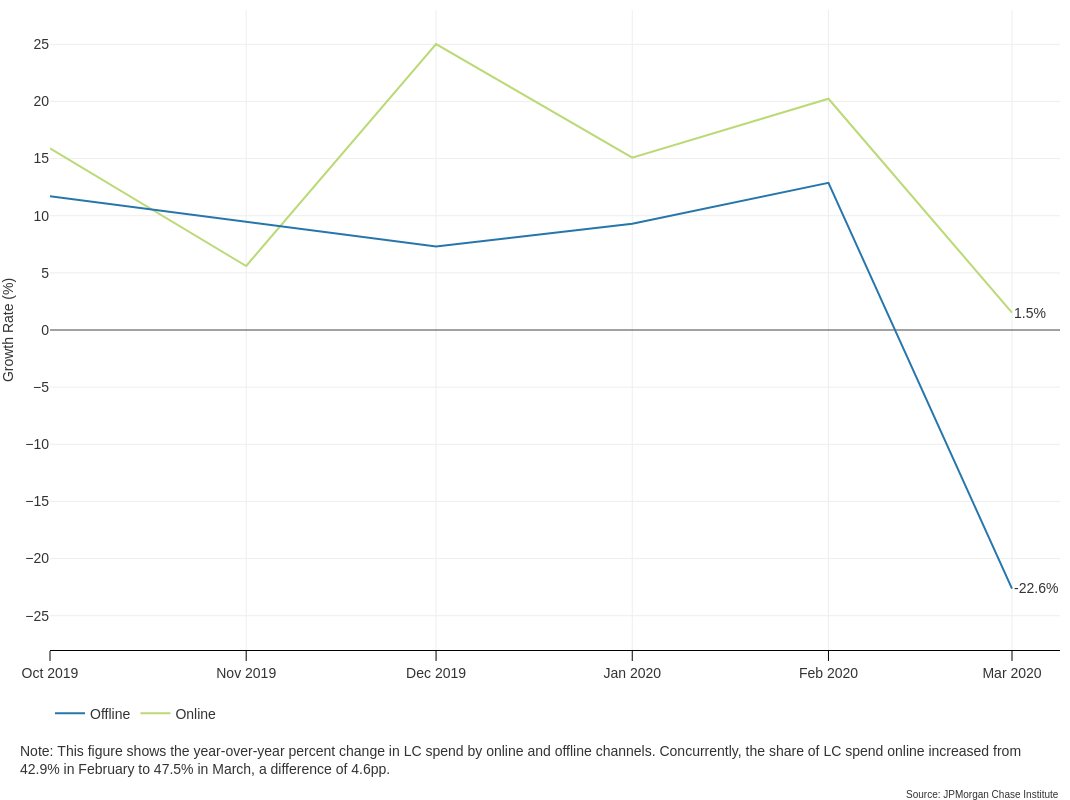
The rise of online commerce over the last three decades has already made deep structural changes in how consumers interact with local producers of goods and services. The pandemic has both accelerated the use of online channels and broadened its use across the population. In efforts to reduce time away from home, we find the online share of LC spend grew from 42.9 percent in February to 47.5 percent in March, a difference of 4.6 percentage point. As a result, online LC spend still grew, though at a notably slower pace in March (1.5 percent) relative to February (20.2 percent), as can be seen in Figure 5.
Figure 5 - Online local commerce spend still grew in March 2020
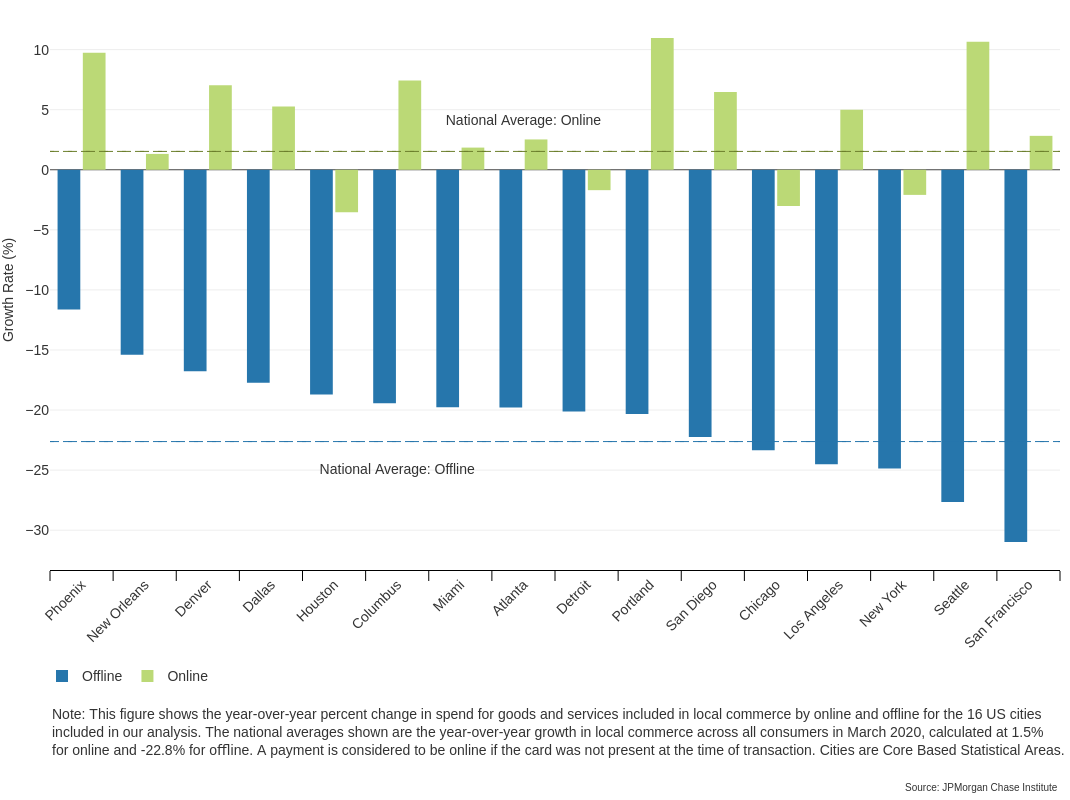
We find that the resilience of online LC in March was uneven across cities. For most, online LC spend growth was positive. However, many of the cities with the severest overall spend declines (Chicago, New York, Detroit, and Houston) had declines in both online and offline spend (Figure 6). As expected, every city we observed saw significant declines in offline spend. San Francisco experienced the most significant contraction with a growth rate of -31.0 percent in offline spend, followed by Seattle (-27.7 percent), New York (-24.9 percent), and Los Angeles (-24.5 percent).
Figure 6 - San Francisco has the largest decline in offline local commerce spend
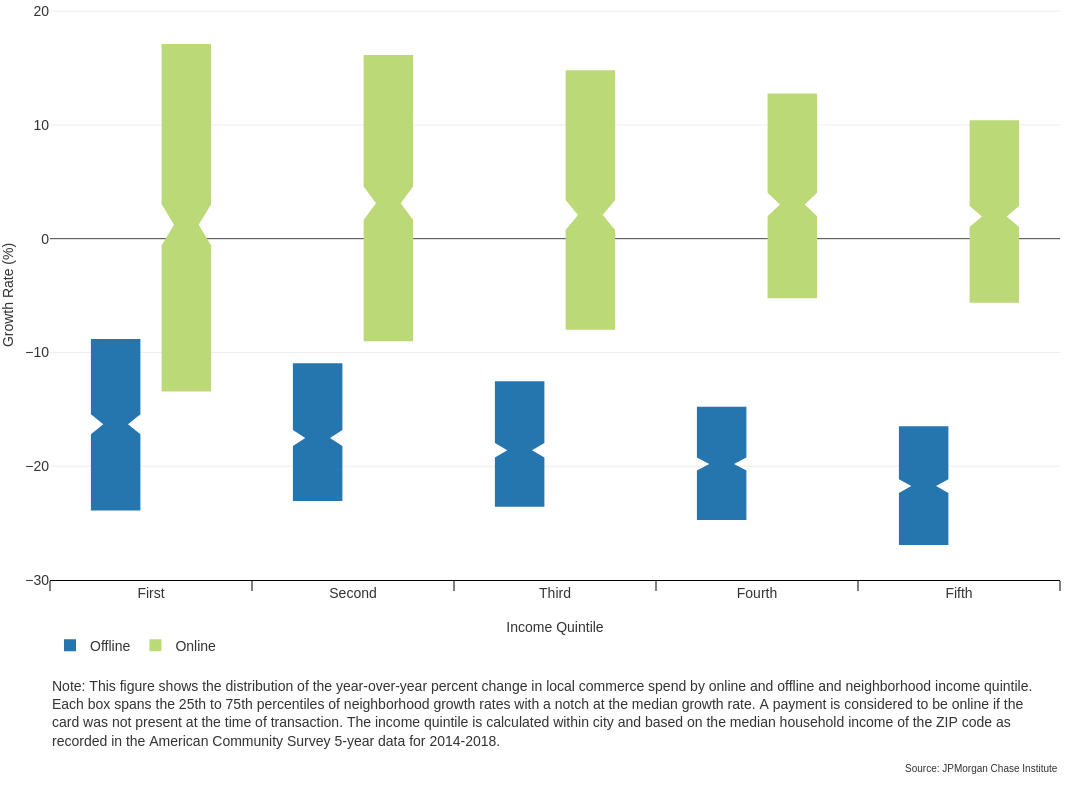
Overall, growth in online commerce did not materially differ by neighborhood income (we find differences for specific goods and services below). Figure 7 shows the distribution of neighborhood LC spend growth across neighborhood income and online versus offline. In March, we observe sharp contractions in offline spend and increases in online spend across each neighborhood income quintile. Median growth was similar across neighborhood income, though as with overall spend, declines in online spend were more likely in low-income neighborhoods. Furthermore, it is notable that across all neighborhood income quintiles, nearly half of neighborhoods reduced their spend offline and online.
Figure 7 - Median growth in online retail was similar across neighborhood income quintiles
The LC view captures, by design, the exchange of a subset of goods and services that are well-represented on cards and specific to interactions between local consumers and producers. This view highlights dynamics in not just the retail goods portion of local economy, but in the consumer services sector as well. Here, we study how the pandemic has changed consumer consumption patterns across the individual goods and services contained in this view. Our results show dramatic shifts in the composition of LC spend for goods and services overall and across online versus offline channels.
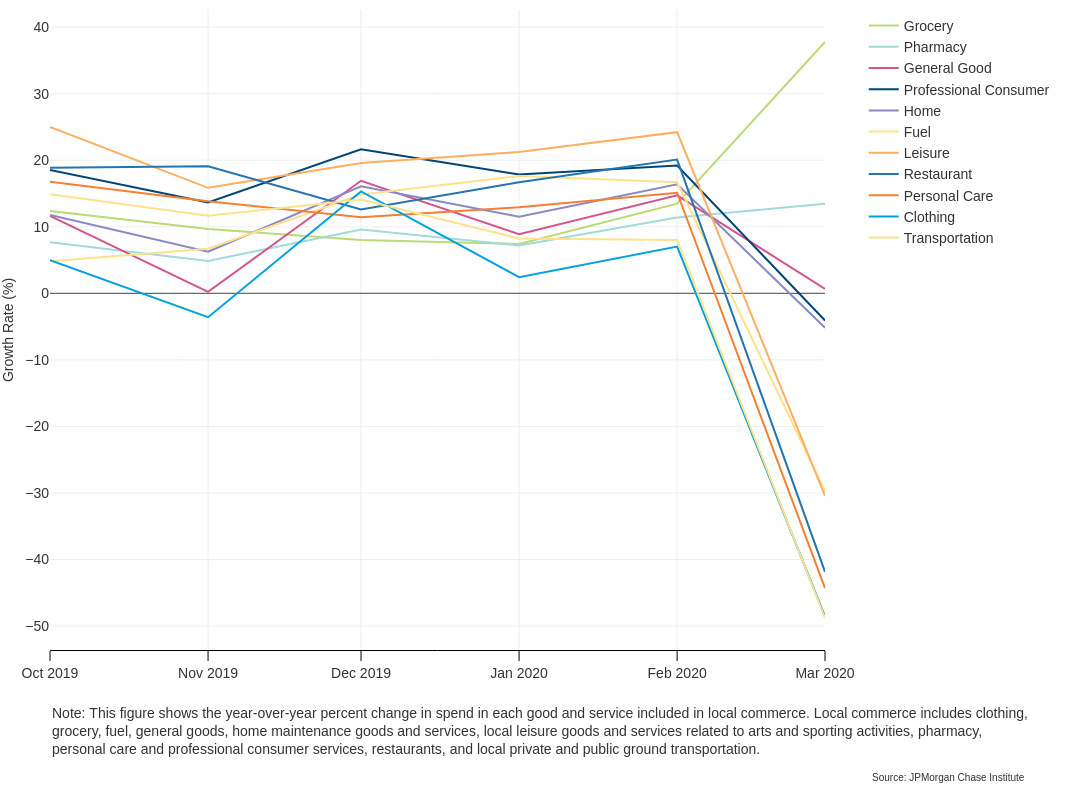
Figure 8 - Only spend at grocery stores and pharmacies increased materially in March 2020
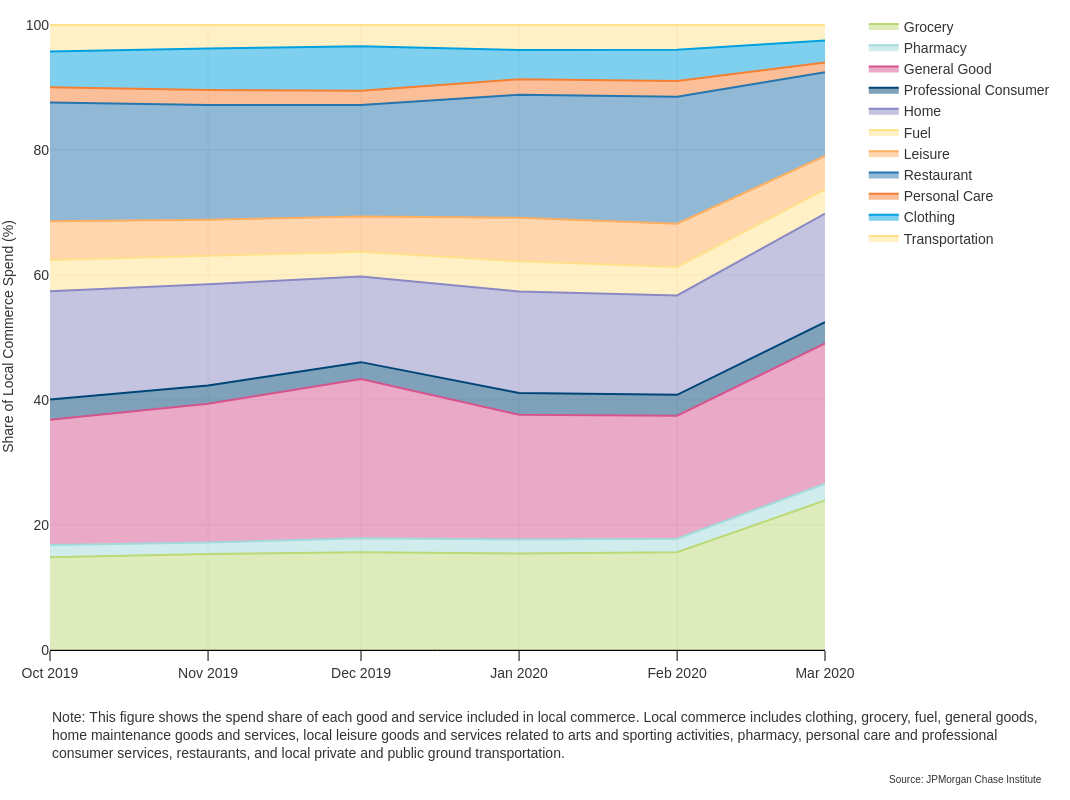
As seen in Figure 8, consumers dramatically decreased their consumption of services related to intra-city transportation (e.g. private car service and public transit), clothing, personal care services (e.g. salons and dry cleaners), restaurants, leisure-related arts and sports services, and fuel. By contrast, there was either no change, or limited contraction, in spend related to goods and services one can consume at or close to home. These include home goods and services (e.g. furniture stores, hardware stores, and landscaping services), professional consumer services (e.g. veterinary, legal, and childcare services), and general goods (e.g. department stores, discount stores, large non-specific online retailers, and other unclassified producers like florists and book stores that we consider to sell everyday goods). Finally, there were two categories that experienced dramatic increases in spend: grocery stores and pharmacies. Figure 9 shows that the share of LC spend at grocery stores and pharmacies grew from 15.6 percent to 23.9 percent and from 2.2 percent to 2.7 percent, respectively, between February and March 2020. For the remaining LC goods and services, the share declined from 82.2 percent to 73.4 percent with the largest decrease in the restaurant share.
Figure 9 - Grocery stores and pharmacies grew to 26.6 percent of local commerce spend in March 2020
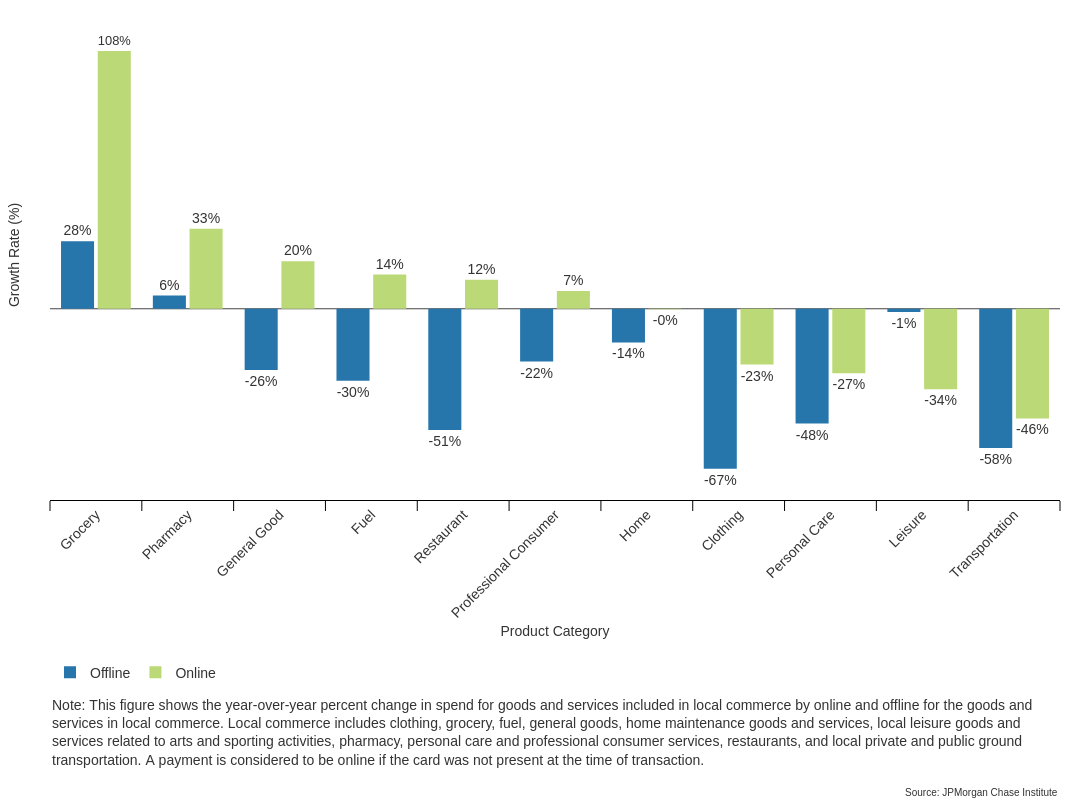
Further decomposing LC spend growth for goods and services purchased online versus offline in March 2020 reveals that the online channel was critical in supporting the acquisition of key goods and services (Figure 10). Online spend on groceries more than doubled, with pharmacies general goods, and restaurants also increasing their online provision substantially. For other goods and services, online provision has not proved a lifeline during the pandemic. Across online and offline channels, personal care services, clothing, and private and public ground transportation have decreased substantially. Declining spend across both channels suggests consumers have far less need for these goods and services when largely confined to the home.
Figure 10 - Online spend on groceries more than doubled
In this final section, we focus on food spend at groceries and restaurants as one way to examine the impact of the pandemic on the well-being of residents across neighborhoods. We find that in March 2020, residents across neighborhoods largely reduced spend on food at similar rates and allocated similar proportions of total LC spend to food. However, we find differences in the use of online food channels across neighborhoods. Consumers are increasing their spend on online groceries and restaurants across the board, but consumers in low-income neighborhoods increased spend on online restaurants more than consumers in other neighborhoods. Meanwhile, consumers in fourth and fifth quintile neighborhoods increased spend on online groceries faster than their lower-income counterparts.
In addition, we study the offline accessibility of grocery stores. To do so, we measure the distances between consumers’ home neighborhoods and the grocery stores at which they transact, then calculate the median distance of those transactions for each consumer neighborhood.12 We find that consumers in low-income neighborhoods are more likely to live farther from their chosen grocery stores. Moreover, during the pandemic, median distances dropped the most for consumers in high-income neighborhoods. Our results by channel and median distance show that despite consistent shifts in grocery spend across neighborhoods of different economic means, consumers in many low-income neighborhoods are not accessing groceries from nearby stores or increasing their online grocery purchases to the same extent as their counterparts in high-income neighborhoods. Both elements increase time away from home, and therefore increase the risk of contagion associated with simply buying food.
Finally, we find that city-specific dynamics can deviate from broad patterns observed across cities, which suggests that our within-city results are particularly useful for local policy makers.13 To highlight our within-city results, we use New York City as an example, which features a median distance for grocery purchases that is much shorter across neighborhoods relative to other cities. Moreover, the cross-quintile pattern is somewhat U-shaped insofar as consumers in both low- and high-income neighborhoods tend to live relatively close to their chosen grocery stores. Furthermore, across all neighborhoods, there is a high correlation between grocery store median distance and increases in offline and online grocery spend.
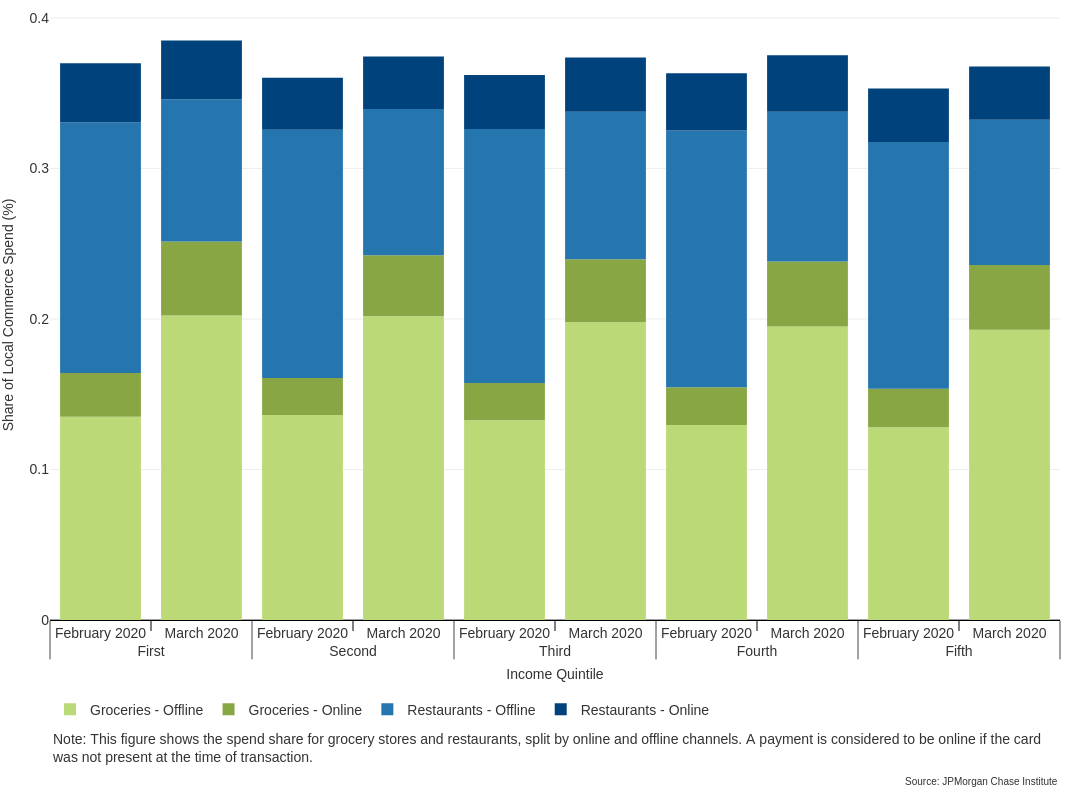
We find that changes in spend shares were largely even for groceries and restaurants across consumers by neighborhood income quintile. Figure 11 shows that in February, total grocery and restaurant spend as a share of LC spend was about 16 percent and 20 percent, respectively, across neighborhoods. In March, all consumers reallocated toward grocery such that grocery and restaurants spend shares were about 24 percent and 13 percent, respectively. Interestingly, we find that consumers in the lowest income neighborhoods increased LC spend share on online groceries more than those in other neighborhoods, with increased spend in the fourth and fifth income quintile neighborhoods above the second and third. This is counterintuitive, given consistent findings in other research that higher-income households spend more on online groceries.14 This may be related to underlying correlations between age and income that are not explored here, or our use of neighborhood rather than consumer income.
Figure 11 - Food spend shifted toward groceries and online across neighborhood income quintiles
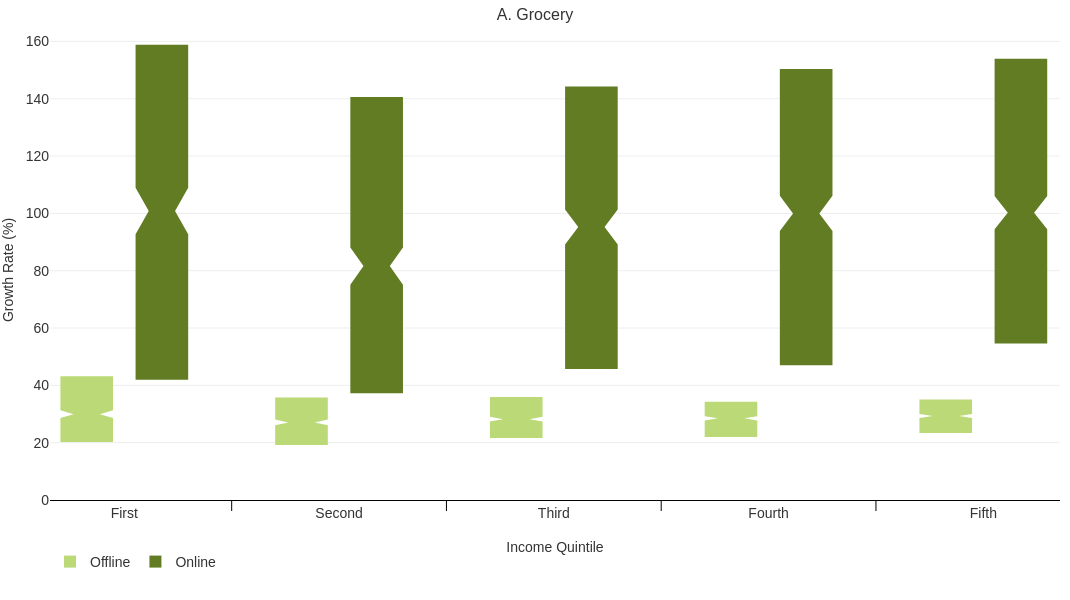
Examining the distribution of growth rates in online groceries by neighborhood income does provide some explanation (Figure 12(a)). There are a subset of neighborhoods in the first income quintile with particularly high growth in online spending on groceries, even though low-income neighborhoods in the first and second income quintile are less likely overall to increase online grocery spending as quickly as higher-income neighborhoods. The neighborhoods with the 25th percentile growth rate in the first and second quintiles experienced online grocery spend growth rates that were 12.6 percentage points and 17.4 percentage points below the corresponding growth rate for the 25th percentile neighborhood in the fifth quintile (54.6 percent). In other words, if we focus on the 25 percent of neighborhoods in each quintile with the lowest rates of growth in online grocery spend, the first and second quintile neighborhoods experienced notably slower growth than their fifth quintile counterparts.
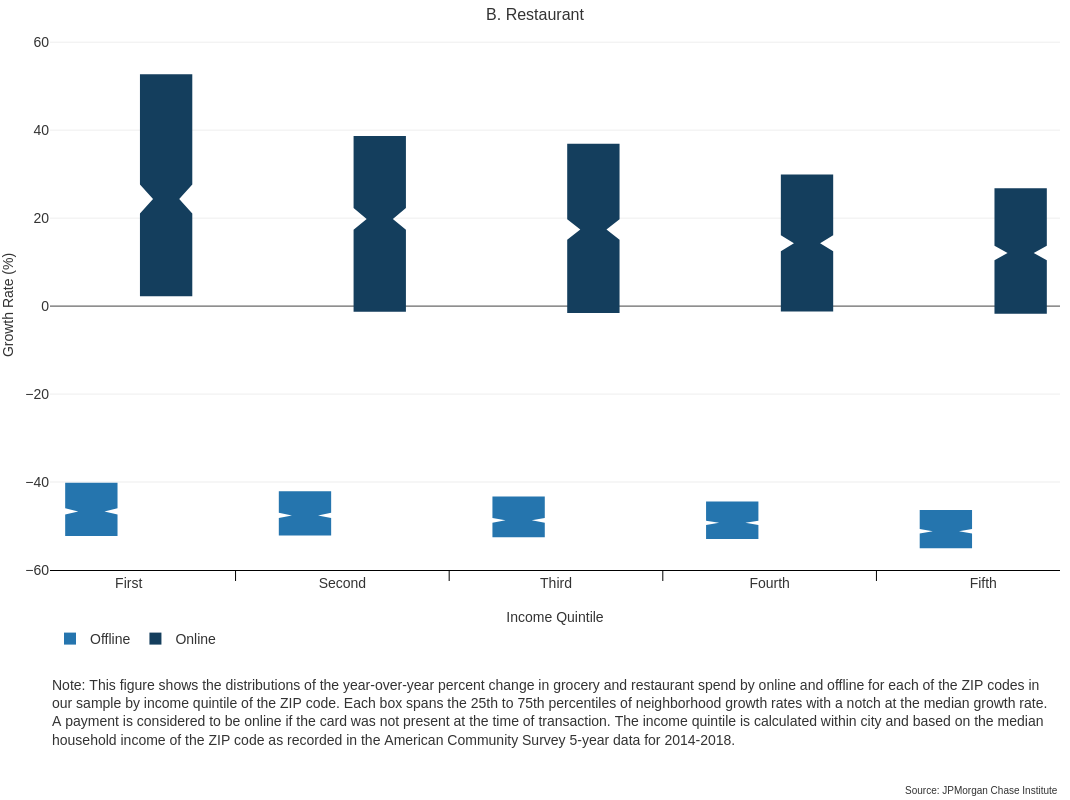
Figure 12- Consumers are differentially increasing spend on online groceries and restaurants
At the same time, low-income neighborhoods are increasing their online restaurant spend faster than high-income neighborhoods at each point of the neighborhood growth distribution (Figure 12 (b)). The median growth rate for first quintile neighborhoods was 24.4 percent, while the growth rate for the fifth quintile was just 12.1 percent. Furthermore, the lowest-income quintile is the only one in which online restaurant spend increased in more than three-quarters of neighborhoods. A fuller explanation for these differences within and across food categories is left for further research.
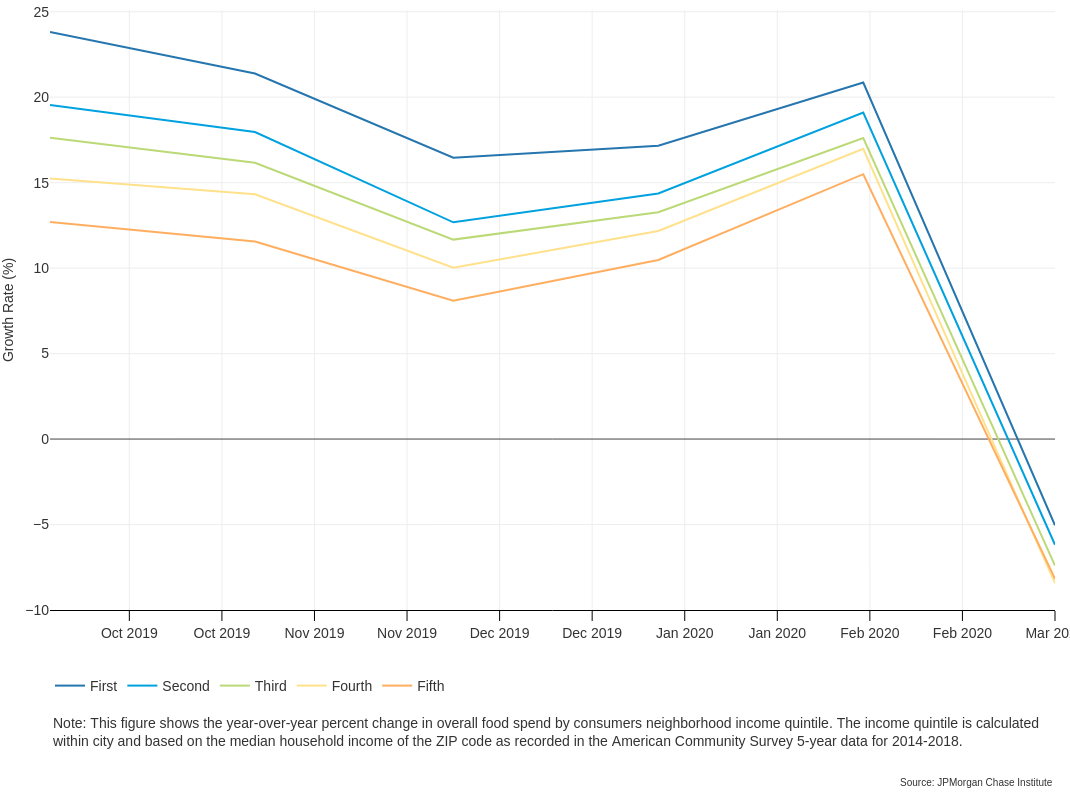
Figure 13 - Overall spend on food declined at least 5.0 percent in all neighborhoods
Overall spending on food decline by 5.0 percent for the lowest-income quintile and 8.4 percent for the fourth-highest-income quintile in March, despite high rates of growth on groceries (Figure 13). The greater decline for high-income neighborhoods is driven by a slightly higher shift away from restaurants. Overall, these results suggest that consumers across neighborhoods are changing their total spend on food in similar ways, but the slower increase in the use of online groceries in many low-income neighborhoods suggests differential access to a key low-risk food channel during the pandemic.
The distance between consumers and the establishments they visit is another important, non-monetary dimension of accessibility to retail goods, particularly now when travel outside the home is higher risk.15 In our previous work, we explored the variation in this distance to illuminate local patterns of disparity across consumers within a city that could not be easily identified with available economic data.16 Our median distance measure accords with intuition insofar as distances are lower in downtown areas and more dense retail areas. It also tends to move slowly across years, because residents and establishments move in and out of neighborhoods at low rates.17
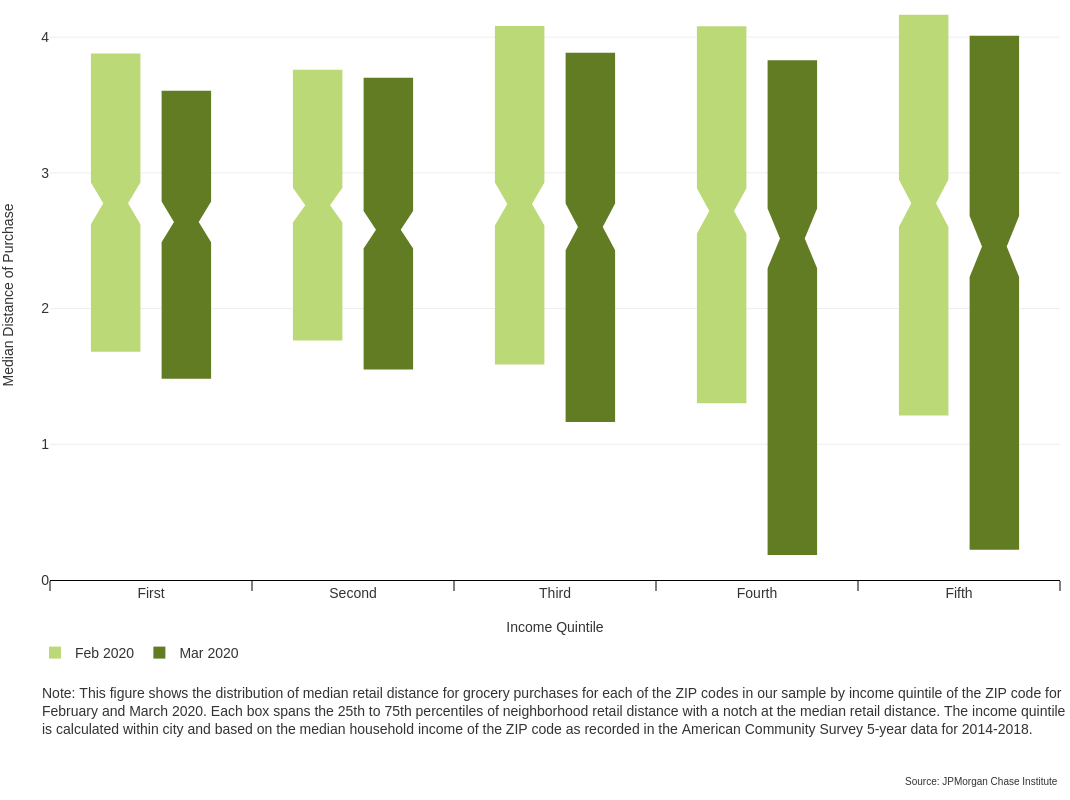
Figure 14 - Grocery store median distance was more likely to fall in high-income neighborhoods
Of deep concern in general, and during the pandemic in particular, is the median retail distance for groceries.18 In Figure 14, we observe that while in March 2019 consumers in the median high-income neighborhood traveled virtually the same distance to grocery stores as consumers in the median low-income neighborhood, there were far more high-income neighborhoods that featured shorter distances than low-income neighborhoods. In other words, consumers in high-income neighborhoods were more likely to travel shorter distances for access to groceries than their low-income counterparts. In March 2020, the median distances for grocery fell for all quintiles, but they fell the farthest for consumers in the highest-income neighborhoods while consumers in the lowest-income neighborhoods experienced little change. We also note that for the fourth and fifth quintile neighborhoods, the 25th percentile distances dropped by 1.1 and 1.0 miles, respectively. Corresponding distributional shifts for the remaining quintiles were also negative, but much more modest. Combined with our results by channel, the disparity in distance changes suggests that many lower income neighborhoods are likely not accessing online groceries and nearby grocery stores to the same extent as consumers in high-income neighborhoods. This wedge in physical access to safer grocery channels is widening during the pandemic.
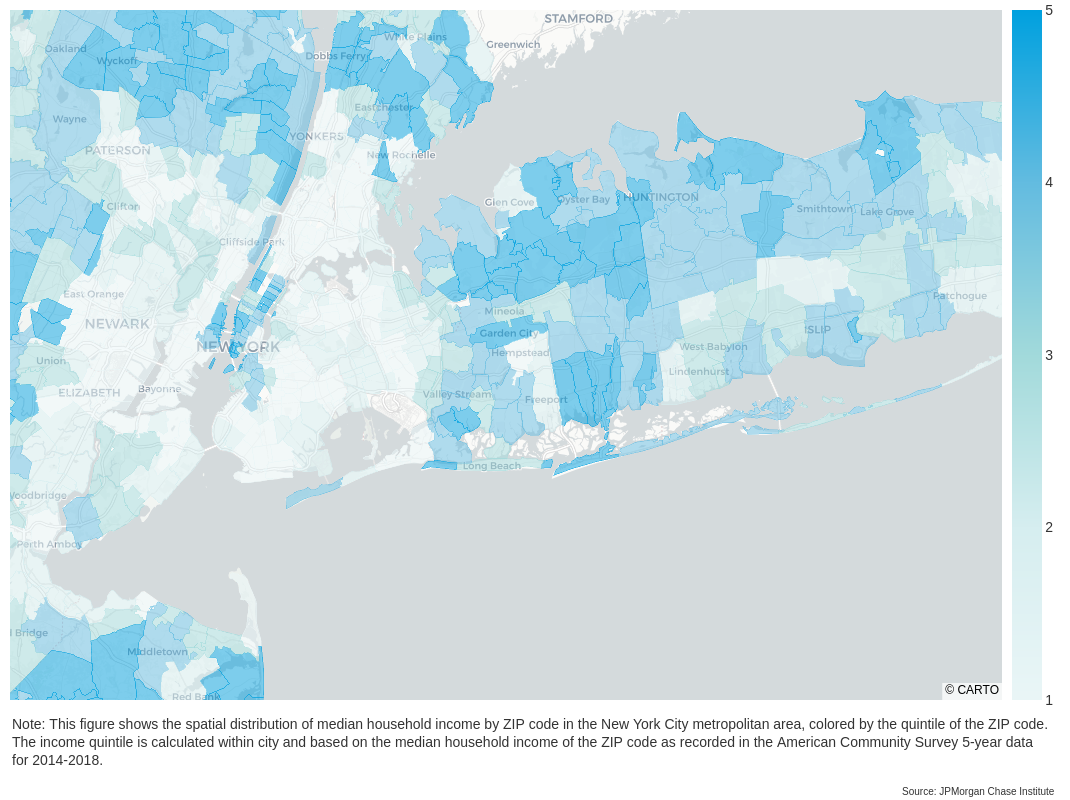
In this section, we examine the within-city spend patterns between neighborhoods of different median household income in the New York City metropolitan area. These within-city patterns for New York may be instructive for dense neighborhoods as well as those hit hard by the crisis. To anchor the discussion, Figure 15 displays the location of neighborhoods in different median household income quintiles. Manhattan south of Harlem, Westchester bordering Connecticut, and eastern parts of Long Island are some areas with high concentrations of high-income neighborhoods. Upper Manhattan, the Bronx, Brooklyn, Queens, and Newark in New Jersey have higher concentrations of low-income neighborhoods.
Figure 15 - NYC metro area neighborhoods by median household income quintile
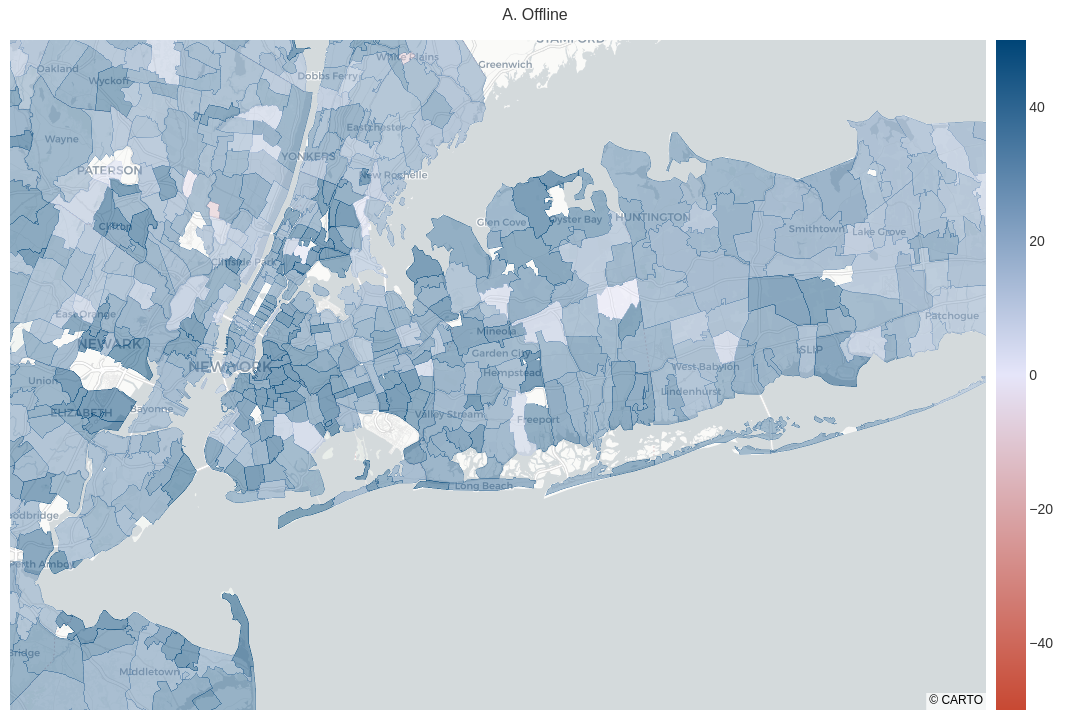
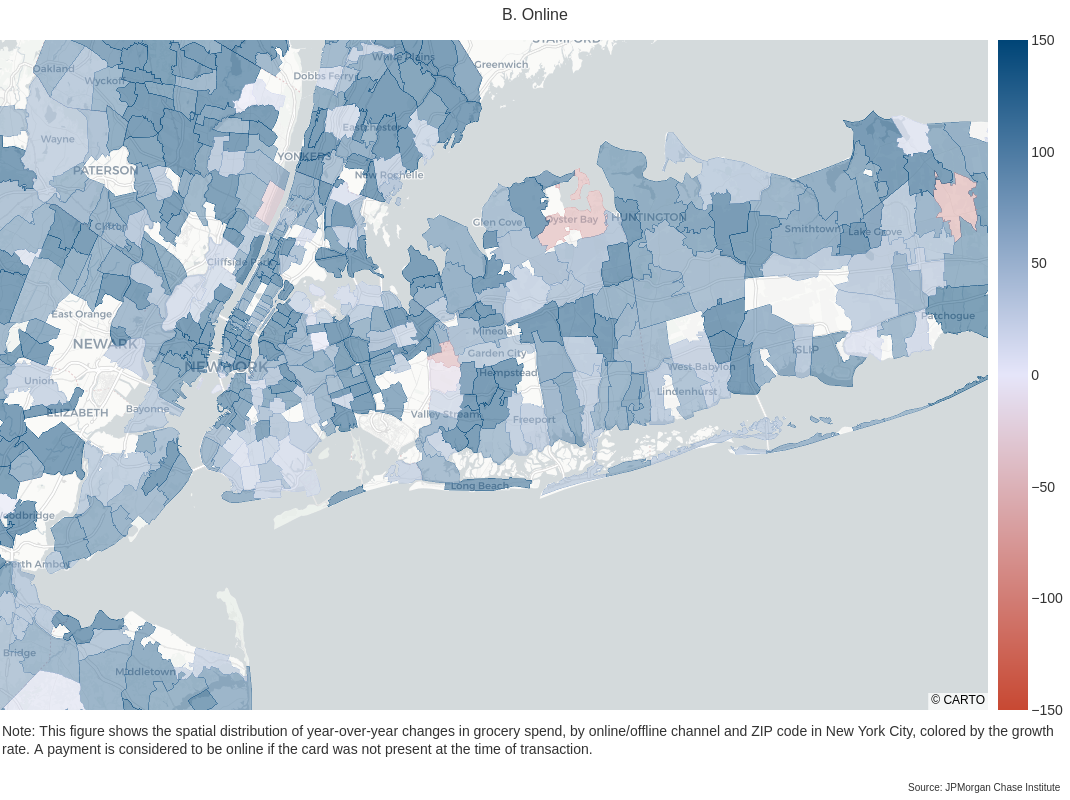
The correspondence between neighborhood income and increases in spend on offline versus online groceries is evident in our neighborhood spend maps (Figure 16). Offline grocery growth is more concentrated downtown, especially in those areas, like Harlem and into the Bronx, with higher concentrations of low-income neighborhoods. The highest growth rates for online grocery are in the wealthier neighborhoods of Manhattan, Westchester, and eastern Long Island.
Figure 16 - NYC metro area offline and online grocery spend shows differential growth across neighborhoods
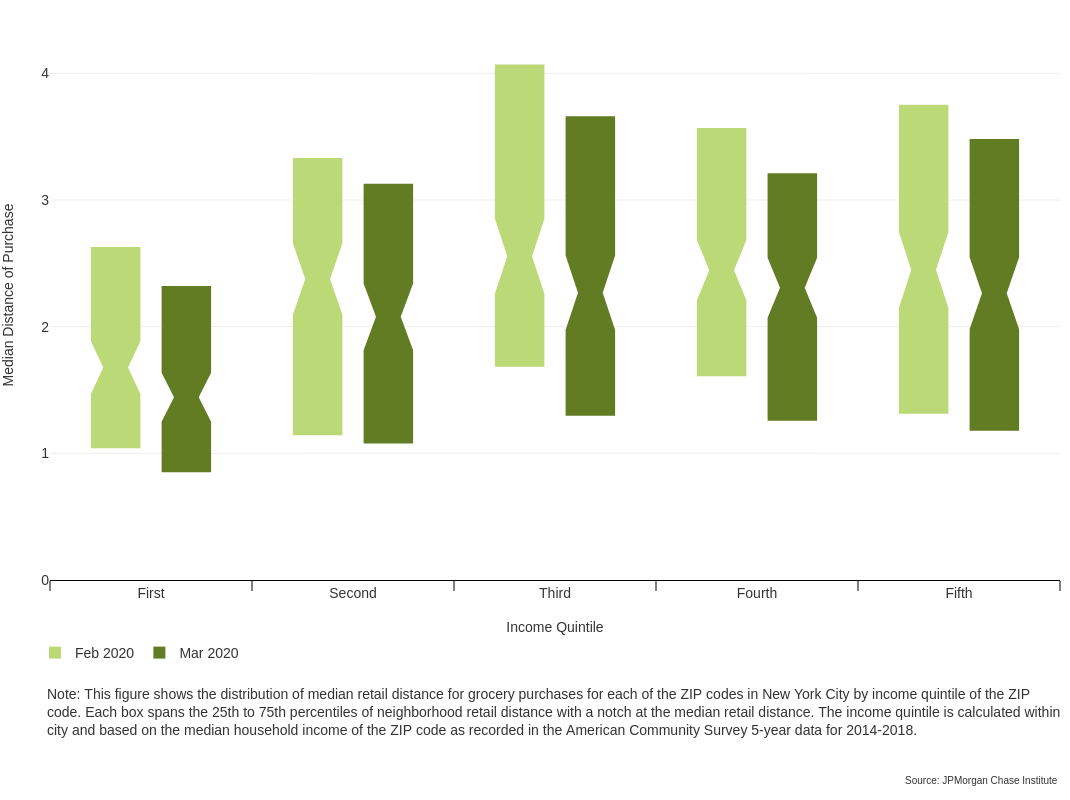
We also find that in contrast to most other cities, median retail distance for groceries across neighborhood income in New York City is somewhat U-shaped (Figure 17). In both March 2019 and March 2020, the consumers in the lowest-income neighborhoods lived the closest to their chosen grocery stores. In March 2020, distances dropped for the median neighborhood in all quintiles, with the largest median drops in the second and third income quintiles, at 0.3 miles less for each. The broad takeaway here is that the offline grocery experience, as measured by median retail distance, was notably different in New York than it was across all cities. To the extent that New Yorkers were able to patronize closer grocery stores across neighborhoods of all income levels, they have done so to an extent not seen when examining all LC cities together.
Figure 17 - NYC metro area grocery store median distance improved in middle income neighborhoods
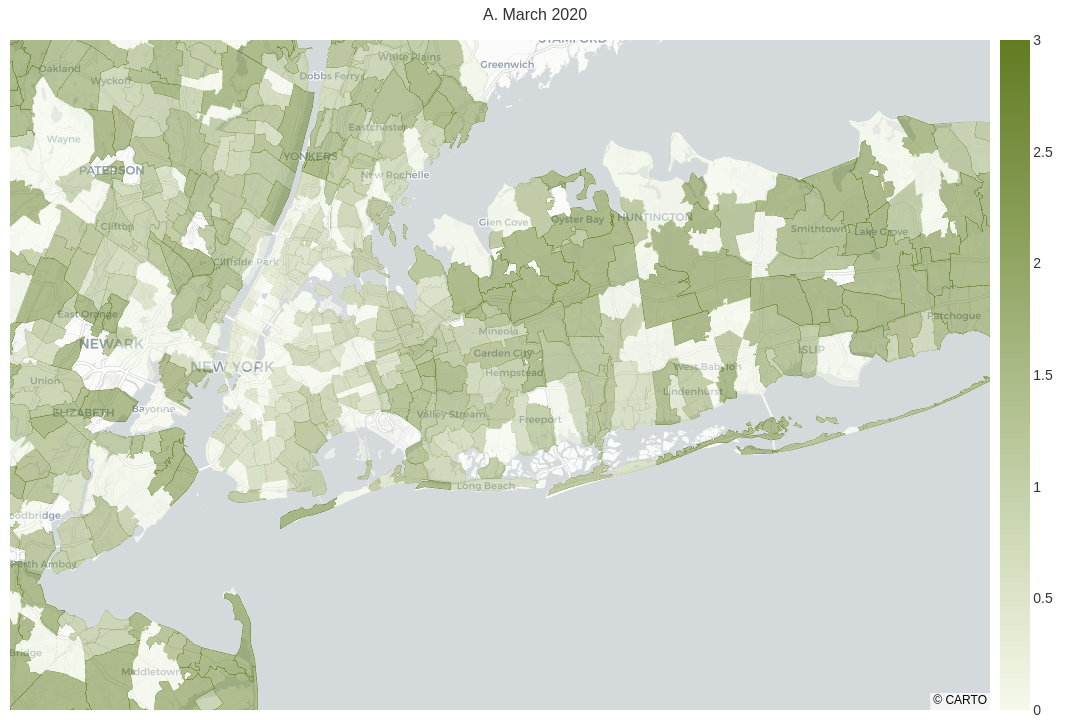
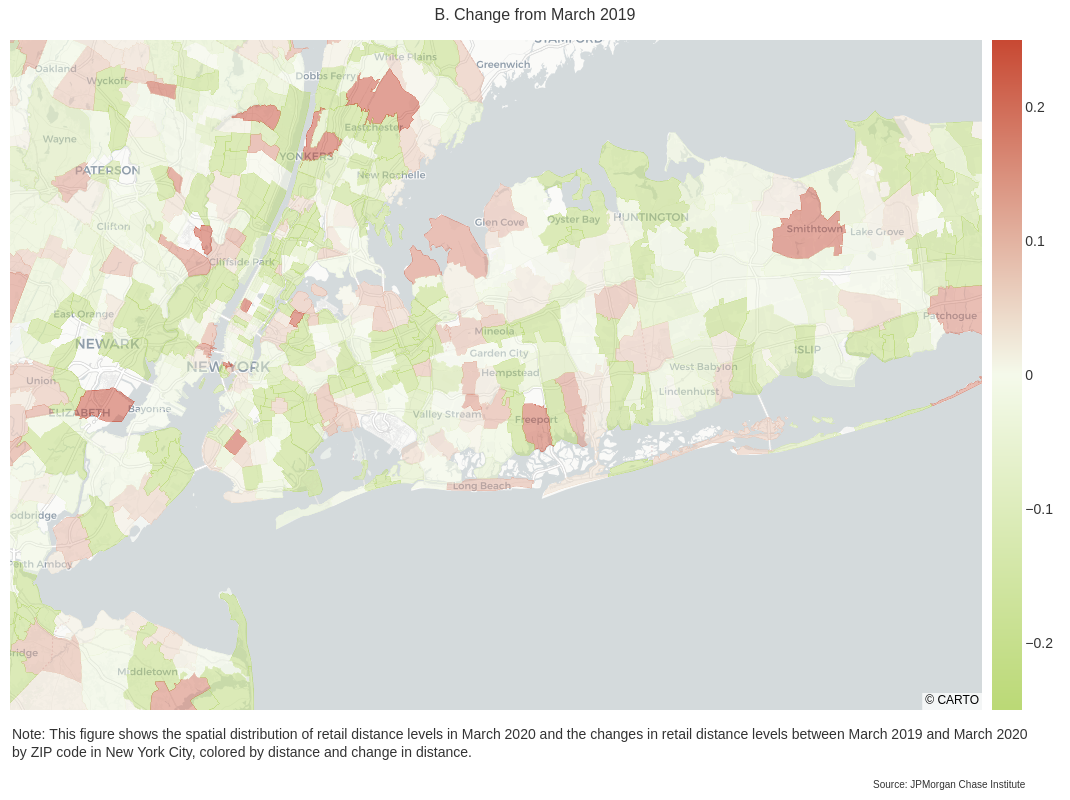
The limited relative movement in distances for high-income neighborhoods coupled with the spatial disparities in the growth of online grocery spend suggests that consumers along the income distribution are reducing grocery store travel through different means in New York City – high-income neighborhoods focused more on online groceries and low-income neighborhoods focused more on grocery spend offline close to home. The patterns of retail distance levels and change for individual neighborhoods can be seen in Figure 18. Despite many New Yorkers demonstrating that they could either find closer grocery stores or access online channels, the spatial variation makes clear that not all New Yorkers have the same opportunity. The spend and retail distance maps can help local officials understand access to groceries by neighborhood and direct resources to those were access is proving most difficult.
Figure 18 - Grocery store median distance improved in the Bronx, Brooklyn, and Queens
The COVID-19 pandemic is most immediately a public health threat, but it is also a significantly disruptive economic event on a scale we have not seen since the Great Depression. The nature of a pandemic generates shocks in both demand and supply across a broad variety of industries, and seriously limits the options available for recovery. The economic hardship we are currently experiencing will likely have a long tail because so many people have lost their jobs and so many businesses will not survive the fallout of the past few months.
The research presented here is an introduction to the unique insights afforded by the JPMorgan Chase Institute data assets into the impact of the pandemic on local commerce across neighborhoods and online. This piece and the forthcoming companion online resources will provide measurement and analysis of impacts that local decision makers can use in their ongoing efforts to support local economies. Future research will explore more of the dynamics introduced here.
[1] Alexander, Diane and Ezra Karger. "Do Stay-at-Home Orders Cause People to stay at Home? Effects of Stay-at-Home Orders on Consumer Behavior." Working Paper No. WP-2020-12. Federal Reserve Bank of Chicago, 2020.
[2] Anderson, Asger Lau, et al. "Consumer Responses to the COVID-19 Crises: Evidence from Bank Account Transaction Data." Working Paper. 2020.
[3] Baker, Scott R., et al. "How Does Household Spending Respond to an Epidemic? Consumption During the 2020 COVID-19 Pandemic." Working Paper No. 26949. National Bureau of Economic Research, 2020.
[4] —. "Income, Liquidity, and the Consumption Response to the 2020 Economic Stimulus Payments." Working Paper No. 27097. National Bureau of Economic Research, 2020.
[5] Carvalho, Vasco M., et al. "Tracking the COVID-19 Crisis with High-resolution transaction data." Discussion Paper No. DP14642. Centre for Economic Policy Research, 2020.
[6] Chen, Haiqiang, Wenlan Qian and Qiang Wen. "The Imapact of the COVID-19 Pandemic on Consumption: Learning from High Frequency Transaction Data." Working Paper. 2020.
[7] Chetty, Raj, et al. "Real-Time Economics: A New Platform to Track the Impacts of COVID-19 on People, Businesses, and Communities Using Private Sector Data." Working Paper. Opportunity Insights, 2020.
[8] Chronopoulos, Dimitris K., Marcel Lukas and John O. S. Wilson. "Consumer Spending Responses to the COVID-19 Pandemic: An Assessment of Great Britain." Working Paper. 2020.
[9] Farrell, Diana, Lindsay Relihan and Marvin Ward. "Going the distance: big data on resident access to everyday goods." Report. JPMorgan Chase Institute, 2017.
[10] —. "Shopping Near and Far: Local Commerce in the Digital Age." Report. JPMorgan Chase Institute, 2018.
[11] Handbury, Jessie, Ilya Rahkovsky and Molly Schnell. "Is the Focus on Food Deserts Fruitless? Retail Access and Food Purchases Across the Socioeconomic Spectrum." Working Paper No. 21126. National Bureau of Economic Research, 2016.
[12] Relihan, Lindsay. "Is Online Retail Killing Coffee Shops? Estimating the Winners and Losers of Online Retail using Customer Transaction Microdata." Working Paper. 2017.
Acknowledgements
We thank James Duguid and Bryan Kim for their substantial contributions to the production and analysis of the research presented here. We also thank colleagues at the JPMorgan Chase Institute for their comments and suggestions. All statistics from JPMCI data, including medians, reflect cells with multiple observations. The opinions expressed are those of the authors alone and do not represent the views of JPMorgan Chase & Co.
Authors
Diana Farrell: JPMorgan Chase Institute
Chris O. Wheat: JPMorgan Chase Institute
Marvin M. Ward Jr.: JPMorgan Chase Institute
Lindsay E. Relihan: London School of Economics &
Centre for Economic Performance
JPMorgan Chase & Co.'s website terms, privacy and security policies don't apply to the site or app you're about to visit. Please review its website terms, privacy and security policies to see how they apply to you. JPMorgan Chase & Co. isn't responsible for (and doesn't provide) any products, services or content at this third-party site or app, except for products and services that explicitly carry the JPMorgan Chase & Co.