We no longer support this browser. Using a supported browser will provide a better experience.
Please update your browser.
Small businesses can be key economic and social contributors in their communities, but they are also often affected by the local socioeconomic conditions of their communities. Previous research has shown that small business outcomes and challenges are very similar across U.S. cities (Farrell, Wheat, and Mac 2018; Farrell and Wheat 2019; Farrell, Wheat, and Grandet 2019a), while small business outcomes within cities exhibit a significant amount of variation across communities (Farrell, Wheat, and Grandet 2019b). This brief focuses on the small business outcomes identified by Farrell et al. (2019b) in the Miami metropolitan area.
Miami is a diverse city that has experienced strong, if slowing, economic growth since 2013. Forty percent of Miami residents are foreign born and 68 percent of metro Miami residents are non-White or Hispanic (2017 5-year ACS). While gross domestic product (GDP) is only one measure of economic output, Miami had the twelfth highest metropolitan area GDP in the country and accounted for over 2 percent of national GDP in 2017. Although annual GDP growth in Miami has been positive since 2013, it slowed from a high of 6.6 percent in 2014 to 2.4 percent in 2017 (Bureau of Economic Analysis, GDP by Metropolitan Area).
Our data asset provides a unique view into Miami’s small business sector, and helps identify where growth may be contributing to Miami’s economic strength.
This brief leverages a subset of the data asset used by Farrell et al. (2019b), and focuses exclusively on the Miami metro area. The full sample of all 25 U.S. cities was constructed from de-identified Chase Business Banking deposit accounts, and includes firms that are both employers and non-employers. However, our sample does not capture firms that operate informally or have deposit accounts with a bank other than Chase. 1
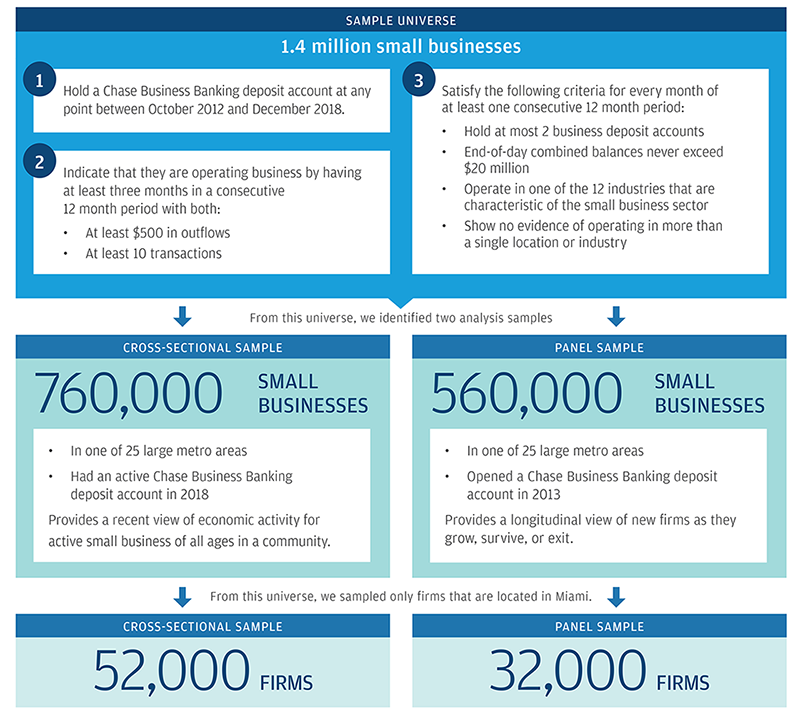
For this brief we subset both the cross-sectional sample and panel sample to firms that are located in the Miami metro area. The cross-sectional subsample consists of 52,000 firms in all 178 metro Miami ZIP codes. The second subsample is a panel of 32,000 firms that were active in 2013. The panel sample allows us to observe business characteristics through time.
The industry distribution of small businesses in Miami is similar to the distribution in the full sample of 25 major U.S. cities. Miami has a slightly higher share of professional services, construction, and repair & maintenance firms, and a slightly lower share of restaurants and retail firms as compared to the full sample. Of the 52,000 firms in the Miami sample, 93 percent are non-employers, and the median age of a firm in our sample is four years.
Table 1: Small business industry shares in Miami and in 25 metro area sample
| High-tech services | Health care services | Other professional services | Real estate | Construction | Repair & maintenance | Restaurants | Retail | |
| Miami | 3.0% | 7.9% | 18.1% | 12.5% | 16.8% | 11.9% | 3.8% | 10.6% |
| 25 U.S. city sample | 3.7% | 9.0% | 15.3% | 11.4% | 14.4% | 9.8% | 5.8% | 12.9% |
Source: JPMorgan Chase Institute
The Miami metropolitan area is comprised of Miami-Dade, Broward, and Palm Beach counties in southern Florida. It includes several principal cities: Miami, Ft. Lauderdale, Boca Raton, Hialeah, Pembroke Pines, and West Palm Beach. In this brief, we use the term “communities” to refer to each of the 178 ZIP codes that comprise the Miami metro area.
Throughout this brief, we study small business outcomes and community characteristics. These characteristics include the community’s racial/ethnic population, shares of foreign-born residents, median home values, and college graduation rates. Table 2 provides a brief summary of these characteristics.
Table 2: Community characteristics in the Miami metro area
| Characteristic | Share of communities |
| Majority White | 31% |
| Majority Black | 9% |
| Majority Hispanic | 30% |
| Majority foreign-born | 20% |
| Share with median home values at or above metro median | 39% |
| Share with at least 50% of people with a college education |
|
Source: JPMorgan Chase Institute
Small businesses can make substantial contributions to their communities. These contributions include investing in local projects, spending revenues locally, and being actively involved in a community’s civic culture. Farrell et al. (2019b) explored small business outcomes by looking at firms’ profitability and cash liquidity in the full sample of 25 U.S. cities. Here we look at the same outcomes for businesses in the Miami metro area.
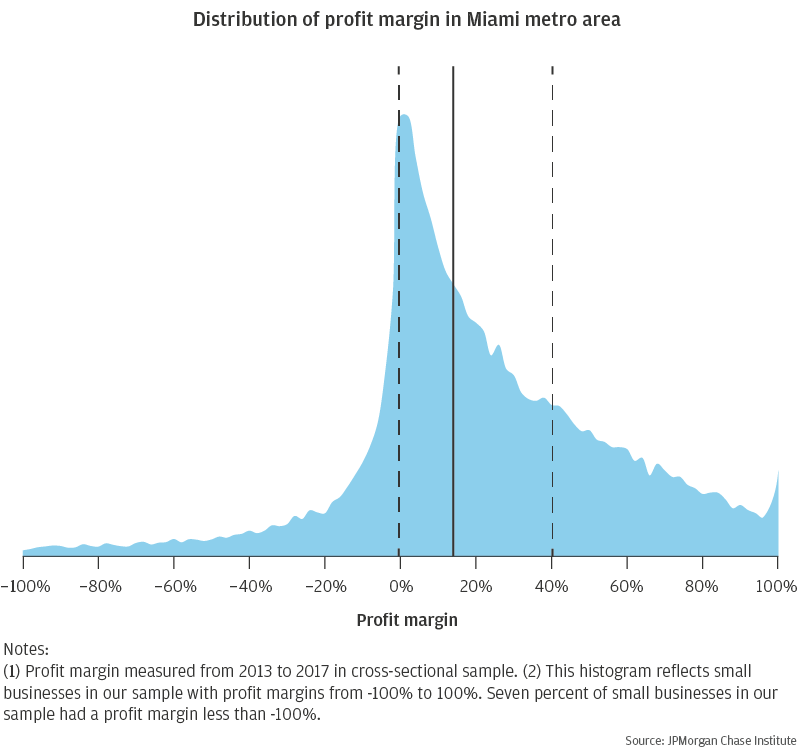
Seventy-five percent of firms in metro Miami were profitable. The histogram in Figure 1 shows the distribution of profit margins at the firm level in Miami. The dashed lines represent the 25th (left) and 75th (right) percentiles while the solid line represents the median profit margin. The median profit margin in the Miami metro area was 13.9 percent. The median profit margin in our sample of 25 U.S. metros was 14 percent (Farrell et al. 2019b), meaning that the median business in the Miami metro was nearly as profitable as the median business in the full sample.
Figure 1: Most small businesses in Miami were profitable
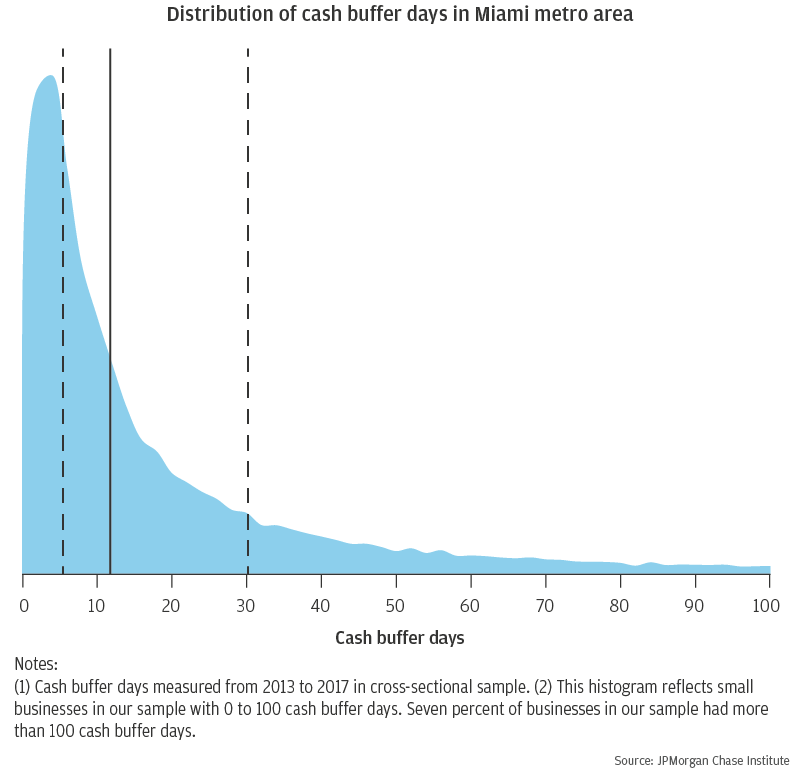
Although 75 percent of firms in the Miami metro area were profitable, many had limited cash liquidity. We measure cash liquidity in terms of cash buffer days, which is the number of days of cash outflows a business could pay out of its cash reserves were its inflows to stop. One-third of businesses in Miami had seven or fewer days of cash liquidity, and less than half of small businesses had at least fourteen cash buffer days. Figure 2 shows the distribution of cash buffer days in the Miami metro area. The dashed lines represent the 25th (left) and 75th (right) percentiles, and the solid line represents the median number of cash buffer days. The median small business in Miami had eleven cash buffer days. The median business in our sample of 25 U.S. metro areas had fifteen cash buffer days (Farrell et al. 2019b).
Figure 2: Many small businesses in Miami had limited cash liquidity
Although most small businesses in Miami are profitable, the median small business in Miami had fewer days of cash liquidity than the median small business in the full JPMC sample. Other research has suggested that cash liquidity is a critical predictor of small business survival and growth (Farrell and Wheat, 2016; Farrell et al. 2018; Farrell et al. 2019a). Therefore, understanding cash and other types of small business liquidity may provide better insight into small business survival in Miami.
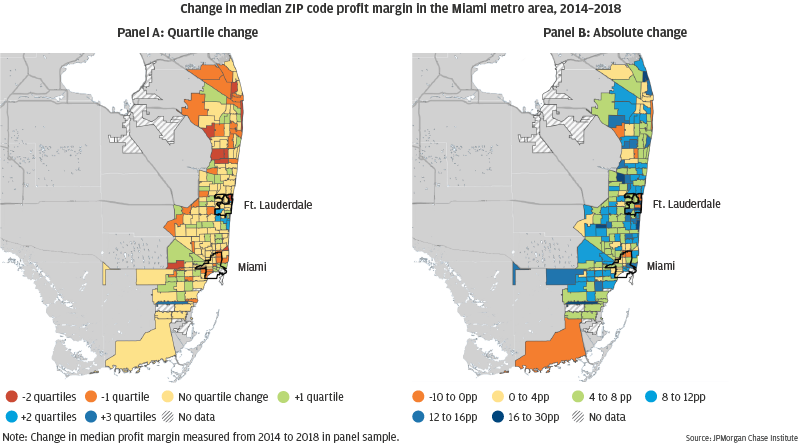
Overall, the community-level structure of small business profitability and cash liquidity in Miami was stable. Figures 3 and 4 illustrate this stability by showing the change in median community profit margin and cash buffer days between 2014 and 2018. Both figures contain two panels: panels 3a and 4a show the change in relative ranking of each community between 2014 and 2018 by quartile, and panels 3b and 4b show the absolute change in median profit margin and cash buffer days from 2014 to 2018, respectively.
The two panels of Figure 3 provide two perspectives on changes in median community profit margins. Panel 3a shows the relative change in median profit margin by sorting each community into quartiles in 2014 and 2018, and then finding the difference between the community’s 2014 and 2018 quartiles.2 The map shows that over half of the communities in metro Miami did not change profit margin quartile over this time period. Less than 40 percent of communities moved a single quartile, and only nine communities (5.2 percent) had a negative shift of more than one quartile.
While the ranking of communities by small business profitability was stable, in aggregate, profit margins increased from 2014 to 2018. Panel 3b shows the percentage point change in median profit margin for each community. During the period from 2014 to 2018 the typical community had a median profit margin increase of 7.5 percentage points—somewhat higher than the 6.2 percentage point typical growth in the full 25 city sample. Nearly half of the communities in the Miami metro had a median profit margin increase greater than 7.5 percentage points, though a few (e.g. Florida City, High Point and Kings Point near Delray Beach, and Imperial Point/Lauderdale-By-The-Sea) experienced a decline in median profit margin. Together, Panels 3a and 3b suggest that many small businesses had significantly higher profit margins in 2018 than they did in 2014, but the relative ranking of communities largely stayed the same. While small business profits may be growing in most Miami communities, community-level gaps in profit margins did not close during this period.
Figure 3: Few communities changed their relative profitability, though most saw increases between 2014 and 2018
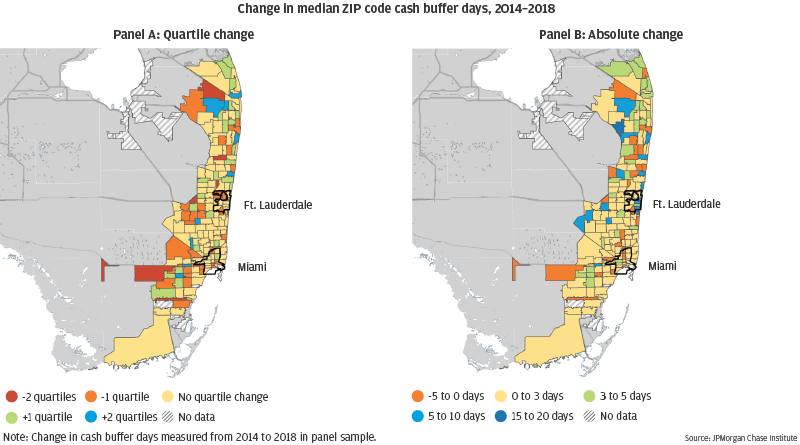
The two panels of Figure 4 provide a parallel view of changes in community-level small business cash liquidity. The overall structure of community-level cash liquidity showed a stability similar to profitability. Panel 4a shows that 58 percent of communities remained in the same cash liquidity quartile from 2014 to 2018. While cash buffer days increased in most communities from 2014 to 2018, these increases were generally modest. Seventy-five percent of communities saw an increase in median cash buffer days of three days or fewer, and 14 percent of communities saw a decline in median cash buffer days. This continues to support our finding that although metro Miami firms are increasing profit margins, they are not experiencing similarly strong increases in cash liquidity. This may suggest that firms do not believe that they need to maintain cash savings, or that they may need to spend a large share of revenues in order to continue business operations. This is in contrast to much larger businesses nationally, which have generally accrued large liquid cash balances since 2012 (Kopp 2018).
Figure 4: Few communities changed their relative cash liquidity, though most saw increases between 2014 and 2018
Many factors within a community can contribute to its economic success generally and to the success of its small businesses specifically. To understand how the socioeconomic differences between communities are associated with the small businesses within them, we measured profit margin and cash liquidity against two variables: home value and the share of a community’s adult population with a college degree.
Home values can be an indicator of community wealth, and can vary widely both across and within cities. In order to approximate community wealth we find the median home value of a community relative to the median home value in the Miami metro. We do this by dividing the community’s median home value by the median home value of the Miami metro area as estimated in the 2017 5-year ACS estimates.3
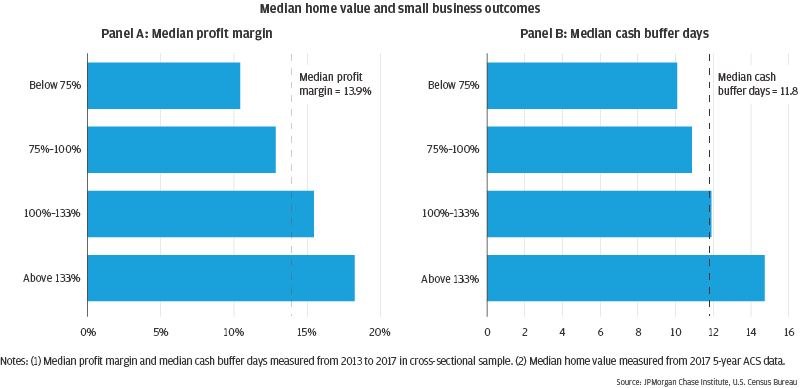
Figure 5 shows the median profit margin and median number of cash buffer days by community home value segment. We define communities with home values below 75 percent of the metro median to be “low home value” communities and those with home values more than 133 percent of the metro median to be “high home value” communities. Both median profit margin and cash buffer days seem related to the median home value of a community, with higher home value communities having higher median profits and cash liquidity.
Panel 5a shows that small business profit margins tended to correlate with home values in the Miami metro. The median small business profit margin in low and moderate home value communities is lower than the Miami-wide median. The median profit margin of small businesses in communities with low home values was about 10 percent, while the median profit margins in communities with the highest home values were 8 percentage points higher than communities with the lowest home values, and about 3 percentage points higher than communities with home values that are comparable to the metro-wide home value.
Panel 5b shows the median number of cash buffer days for small businesses in each home value segment. As with profit margin, the number of cash buffer days seems to correlate with community home value. The range in the median number of cash buffer days between high and low home value communities is almost five days, but the range between communities with low home values and communities with home values similar to the metro-wide median is less than two days. This suggests that communities that have high wealth (as indicated by high home values) also tend to have businesses that maintain a higher amount of cash savings than those in low home value communities.
Figure 5: Small businesses in high home value communities had higher profits and more cash liquidity than those in low home value communities
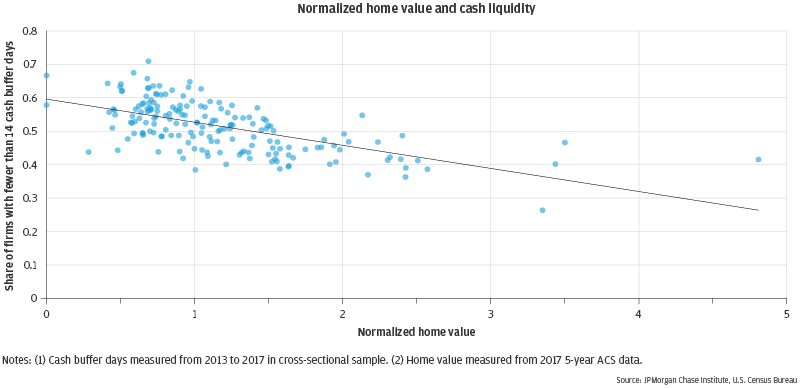
Due to the strong relationship between cash liquidity and small business survival (Farrell and Wheat, 2016; Farrell et al. 2018; Farrell et al. 2019a) we looked at the share of firms in a community with fewer than fourteen cash buffer days and the relative home value of the meaning that the share of firms in a community with fewer than two weeks of cash liquidity was comparatively high in communities with low relative home values. The correlation between normalized home value and the share of firms with fewer than fourteen cash buffer days was -0.61.
Figure 6: Communities with higher home values had fewer small businesses with limited cash liquidity
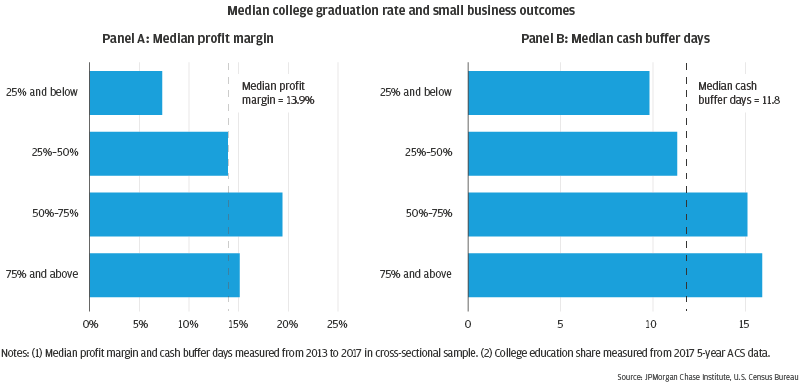
College education is often used to proxy human capital, and has been positively correlated with individual well-being outcomes. These outcomes may aggregate to positive community outcomes. We measure the share of college graduates by finding the share of a community’s adult population that has an associate’s degree as estimated in the 2017 5-year ACS estimates.
Figure 7 groups small businesses by the share of adults in a community with a college degree. Communities are grouped from a low share of college graduates (25 percent and below) to a high share of college graduates (75 percent and above). The median profit margin is highest in communities where 50 to 75 percent of adults had a college degree, and lowest in communities where 25 percent or less of adults have a college degree.
Panel 7a shows the median profit margin in communities with similar levels of college education. Only four communities in the Miami metro had a college graduate share 75 percent and above, whereas nearly one-in-three Miami communities had college graduate shares between 50 and 75 percent. Small businesses in communities with college graduate shares between 50 and 75 percent had a median profit margin that was 5.6 percentage points higher than the metro-wide median profit margin. Generally, the median profit margin increases with the share of adults with a college education.
Panel 7b shows the median number of cash buffer days in communities by the share of adults with a college education. The median number of cash buffer days tended to be highest in communities where more adults had a college degree. The median number of cash buffer days in almost every education grouping is comparable or greater than the metro-wide median.
Figure 7: Small businesses in communities with many college graduates had higher profits and more cash liquidity than those in communities with few college graduates
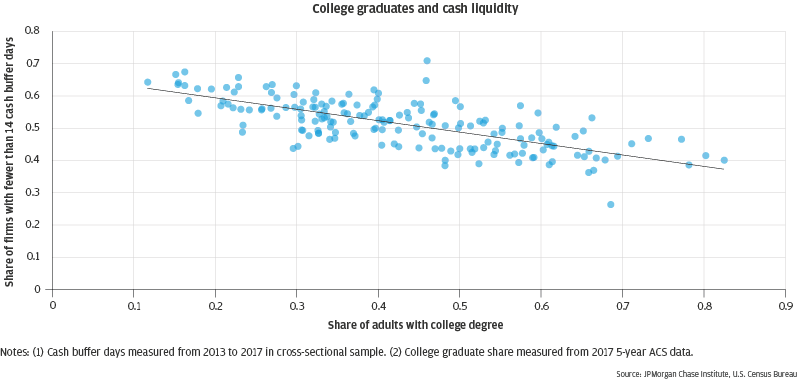
Figure 8 shows the relationship between the share of businesses with fewer than fourteen cash buffer days and the share of adults with a college degree within a community. The scatter plot shows a negative relationship: communities with a lower share of adults with a college degree tend to have a higher share of firms with fewer than two weeks of cash buffer days. The correlation between college graduate rate and the share of firms with fewer than fourteen cash buffer days is -0.71.
Figure 8: Communities with many college graduates had fewer small businesses with limited cash liquidity
To understand the differences in small business outcomes between communities with different racial and ethnic compositions, we first looked at the share of firms across eight industries in majority White, Black, Hispanic, and “all other” communities as estimated in the 2011 5-year ACS.4 As previously discussed, 31 percent of the Miami metro area communities were majority White, 30 percent were majority Hispanic, and 9 percent were majority Black. The remaining 28 percent of communities did not have a single racial or ethnic group that accounted for a majority of their populations. Additionally, in nearly 20 percent of communities, the majority of the population was foreign-born. Communities are identified as “majority foreign-born” and by race or ethnicity. All but five “majority foreign-born” communities are also majority Hispanic.
Table 3: Small business industry shares by resident race, ethnicity, or foreign-born status
| High-tech services | Health care services | Other professional services | Real estate | Construction | Repair & maintenance | Restaurants | Retail | |
| Majority White | 3.7% | 8.4% | 20.7% | 15.1% | 14.3% | 10.1% | 3.4% | 9.8% |
| Majority Black | 1.6% | 5.7% | 13.8% | 8.1% | 20.1% | 16.4% | 4.6% | 14.4% |
| Majority Hispanic | 2.7% | 8.8% | 17.3% | 11.0% | 17.8% | 11.9% | 3.7% | 10.5% |
| All other communities | 3.1% | 6.9% | 17.9% | 13.4% | 16.7% | 12.5% | 4.1% | 10.5% |
| Majority foreign-born | 2.5% | 9.3% | 17.3% | 11.8% | 17.2% | 10.9% | 4.0% | 10.7% |
| Metro Miami | 3.0% | 7.9% | 18.1% | 12.5% | 16.8% | 11.9% | 3.8% | 10.6% |
Cells marked indicate that the share of small businesses in an industry for the community type is higher than the share of small businesses in an industry in the Miami metro area.
Source: JPMorgan Chase Institute
In Table 3, we classify communities as majority White, Black, Hispanic, or “all other.” These racial or ethnic groupings are mutually exclusive. We then identify communities where a majority of its residents are foreign born. A community is categorized by racial/ethnic group and by the share of residents who are foreign born. Thirty-five communities in Miami had a majority foreign-born population, of which thirty were majority Hispanic, two were majority Black communities, and three were categorized as "all other communities."
In general, most communities in Miami had a very low share of restaurants and high-tech services firms and a high share of either professional services or construction firms. Although more than one-in-seven firms in majority Black communities were professional service businesses, majority Black communities had the lowest share of these firms. Similarly, majority White communities had the smallest share of construction firms, but more than one-in-seven firms in these communities were construction businesses.
Cells with blue diamonds in Table 3 indicate that the share of firms in an industry for a given community type was above the Miami metro share of firms in that industry. Industries that were more prevalent in majority White communities (high-tech services, other professional services, and real estate) were less prevalent in non-White communities. Communities with a majority maintenance industries. Firms in each of these industries were among the most overrepresented in majority Black communities when compared to the metro-wide share. For example, the share of construction and repair & maintenance firms in majority Black communities were 3.3 and 4.5 percentage points higher than the metro share, respectively.
Majority foreign-born and majority Hispanic communities are very similar. Of the thirty-five majority foreign-born communities, thirty were also categorized as majority Hispanic. Since, for this analysis, we do not treat the demographics of a community as a continuous variable it could be expected that majority Hispanic and majority foreign-born communities contained similar industries in metro Miami. This might suggest that the slight differences in industry between these communities (e.g. health care services and repair & maintenance) are related to community demographics. Further research could provide information on the types of firms likely to operate in immigrant communities compared to majority native-born communities.
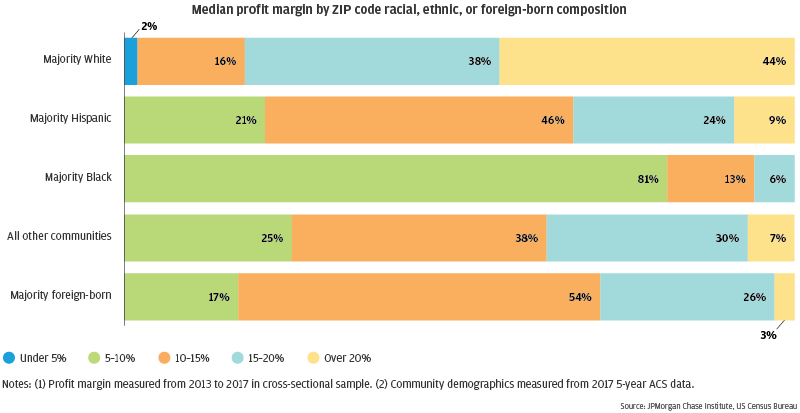
Figure 9 shows median small business profit margins for communities grouped by racial, ethnic, and foreign-born composition. Notably, 44 percent of majority White communities had median small business profit margins greater than 20 percent, while no more than 9 percent of any other community racial, ethnic, and foreign-born demographic group had median profits at that high of a level. Most majority foreign-born communities also had a population that was mostly Hispanic, which may help explain the similar profitability outcomes for these two types of communities—about one-in-three of each of these types of communities had a median profit margin over 15 percent. In contrast, only about one-in-twenty majority Black communities in Miami had a median profit margin over 15 percent, and the median profit margin in four-in-five such communities was 10 percent or less.
Figure 9: Few majority Black, Hispanic, or foreign-born communities had very profitable small businesses
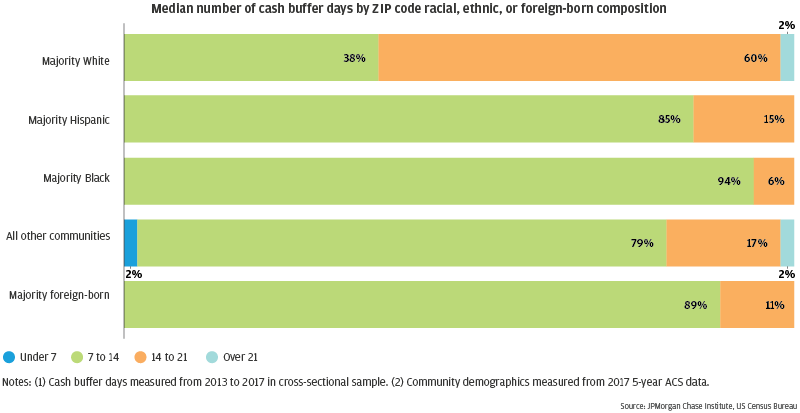
Figure 10 shows the median number of cash buffer days in communities grouped by racial, ethnic, and foreign-born composition. The median firm in metro Miami had about twelve days of cash liquidity, and the median firm in almost all groups had at least seven cash buffer days. The median firm in 60 percent of majority White communities had at least two weeks of cash liquidity, while just over one-in-six majority Hispanic communities had a median of at least fourteen cash buffer days. All other majority-minority group communities had even fewer businesses with more than at least fourteen median cash buffer days.
Figure 10: Small businesses with large cash buffers are rare in majority Black, Hispanic, or foreign-born communities
While small businesses in the Miami metro area have slightly stronger profit margins and slightly weaker cash liquidity measures than those in our full sample, we found substantial variation in these outcomes across the many communities that comprise the region. Moreover, the differences we observed across communities appeared stable over time, suggesting that other structures that might affect small business financial performance are persistent as well. Importantly, these community-level differences were persistent during a period of broad growth in the Miami regional economy.
Taken together, these findings are broadly consistent with the findings from our larger sample, which suggests a similar set of policy implications. First, broad-based economic growth in the Miami economy may benefit from place-based small business economic development programs. Second, programs and policies intended to help small businesses—either national or specific to the region—may be more effective if they are integrated with initiatives that address household financial wealth and education. Finally, the differences we found suggest that programs that support small businesses could be more responsive to the characteristics of the businesses in communities where people of color and immigrants live.
Bureau of Economic Analysis. GDP by Metropolitan Area. Last modified: 9 April 2019. Accessed: 18 September 2019. https://www.bea.gov/data/gdp/gdp-metropolitan-area
Farrell, Diana and Christopher Wheat. 2016. “Cash is King: Flows, Balances, and Buffer Days.” JPMorgan Chase Institute. https://institute.jpmorganchase.com/institute/research/small-business/report-cash-flows-balances-and-buffer-days
Farrell, Diana and Christopher Wheat. 2019. “The Small Business Sector in Urban America: Growth and Vitality in 25 Cities.” JPMorgan Chase Institute. https://institute.jpmorganchase.com/institute/research/small-business/report-small-business-outcomes-cities
Farrell, Diana, Christopher Wheat, and Carlos Grandet. 2019a. “Facing Uncertainty: Small Business Cash Flow Patterns in 25 U.S. Cities.” JPMorgan Chase Institute. www.jpmorganchase.com/corporate/institute/report-facing-uncertainty.htm
Farrell, Diana, Christopher Wheat, and Carlos Grandet. 2019b. “Place Matters: Small Business Financial Health in Urban Communities.” JPMorgan Chase Institute. https://institute.jpmorganchase.com/institute/research/small-business/place-matters-small-business-financial-health-in-urban-communities
Farrell, Diana, Christopher Wheat, and Chi Mac. 2018. “Growth, Vitality, and Cash Flows: High-Frequency Evidence from 1 Million Small Businesses.” JPMorgan Chase Institute. https://institute.jpmorganchase.com/institute/research/small-business/report-growth-vitality-cash-flows
Farrell, Diana, Christopher Wheat, and Chi Mac. 2019c. “Gender, Age, and Small Business Financial Outcomes.” JPMorgan Chase Institute. https://institute.jpmorganchase.com/institute/research/small-business/report-small-business-financial-outcomes
Kopp, Emanuel. 2018. “Determinants of U.S. Business Investment.” IMF Working Paper. International Monetary Fund, June 2018. https://www.imf.org/en/Publications/WP/Issues/2018/06/15/Determinants-of-U-S-45985
U.S. Census Bureau. “American Community Survey 2017 5-year estimate.” Accessed via AmericanFactFinder: 8 October 2019. https://factfinder.census.gov/faces/nav/jsf/pages/download_center.xhtml
U.S. Census Bureau. “American Community Survey 2011 5-year estimate.” Accessed via AmericanFactFinder: 8 October 2019. https://factfinder.census.gov/faces/nav/jsf/pages/download_center.xhtml
This brief reflects substantial analytic and drafting efforts from Nicholas Tremper, prior analytic work from Carlos Grandet, leadership and process management from Chi Mac, and meticulous fact-checking from Anu Raghuram. We thank each of them specifically for their hard work and contributions to this research.
We are also grateful for the invaluable constructive feedback we received both from internal colleagues and external academic and industry policy experts, including but not limited to Maria Ilcheva and Stanley Rigaud. We are deeply grateful for their generosity of time, insight, and support.
This effort would not have been possible without the diligent and ongoing support of our partners from the JPMorgan Chase Consumer and Community Bank and Corporate Technology teams of data experts, including, but not limited to, Howard Allen, Anoop Deshpande, Andrew Goldberg, Senthilkumar Gurusamy, Derek Jean-Baptiste, Ram Mohanraj, Stella Ng, Subhankar Sarkar, and Melissa Goldman. The project, which encompasses far more than the report itself, also received indispensable support from our internal partners in the JPMorgan Chase Institute team, including Elizabeth Ellis, Alyssa Flaschner, Anna Garnitz, Carolyn Gorman, Courtney Hacker, Sarah Kuehl, Caitlin Legacki, Sruthi Rao, Carla Ricks, Tremayne Smith, Gena Stern, Maggie Tarasovitch, and Preeti Vaidya.
Finally, we would like to acknowledge Jamie Dimon, CEO of JPMorgan Chase & Co., for his vision and leadership in establishing the Institute and enabling the ongoing research agenda. Along with support from across the firm—notably from Peter Scher, Max Neukirchen, Joyce Chang, Marianne Lake, Jennifer Piepszak, Lori Beer, and Judy Miller—the Institute has had the resources and support to pioneer a new approach to contribute to global economic analysis and insight.


JPMorgan Chase & Co.'s website terms, privacy and security policies don't apply to the site or app you're about to visit. Please review its website terms, privacy and security policies to see how they apply to you. JPMorgan Chase & Co. isn't responsible for (and doesn't provide) any products, services or content at this third-party site or app, except for products and services that explicitly carry the JPMorgan Chase & Co.