We no longer support this browser. Using a supported browser will provide a better experience.
Please update your browser.
Background
Amidst widespread economic instability brought on by the COVID-19 pandemic, the Federal Reserve moved to quell market fears by swiftly dispatching its toolkit. It cut its headline policy interest rate to zero and implemented quantitative easing (QE)—large-scale asset purchases that feed liquidity into financial markets. These measures, aimed at mitigating steep declines in economic activity, work in part through household balance sheets to encourage consumer spending by making borrowing more affordable. As a result of the Federal Reserve’s actions, mortgage rates dropped to record lows, leading to a surge in demand for mortgage credit in 2020. However, the pandemic also triggered broader economic changes that affected different household groups in varying ways and raised critical questions about the distributional effects of the Federal Reserve’s COVID-19 monetary policy interventions.
Homeowner financial stability is closely connected to macroeconomic developments (e.g., high unemployment) and resulting monetary policy responses, which affect household balance sheets to varying degrees. With monetary policy easing, many homeowners, aided by historically low interest rates, opted to refinance their mortgages. Refinancing has the potential to improve the financial stability of liquidity-constrained households by providing supplemental liquidity from reduced mortgage payments to increase consumption or savings. On average, borrowers using cash-out refinancing consumed 33 percent of the equity received within a year, and consumption rates were higher for younger households and those with liquidity constraints (Farrell et al., 2020). Lower interest rates also make it easier for borrowers to keep up with payments and substantially reduce the likelihood of default. In fact, a 10 percent reduction in a homeowner’s mortgage payment could reduce their likelihood of default by 27.5 percent (Ehrlich and Perry, 2015). Despite extraordinarily favorable interest rates during the COVID-19 pandemic, mortgage refinancing was not accessible to all households. White, Asian, and higher-income borrowers benefitted disproportionately compared to Black, Hispanic, and low-income borrowers (Agarwal et al., 2021; Gerardi et al., 2020; Gerardi et al., 2021).
This brief expands on previous analyses of COVID-19 refinancing trends by examining the variation in mortgage affordability and refinancing cost burden across race, ethnicity, and income. We utilized property-level deed records from a proprietary source in conjunction with publicly available HMDA data to evaluate the downstream effects of refinancing and present five key findings:
The return to zero-bound interest rates provided homeowners an exceptional opportunity to capitalize on historically low interest rates and gain access to wealth-building through mortgage refinancing. Nevertheless, our findings suggest that these gains were unevenly distributed, with significant implications for the widening racial wealth divide and homeowner financial stability. Our findings underscore the importance of lowering barriers to mortgage refinancing and implementing policies that encourage low-income, Black, and Hispanic homeowners to refinance.
Data
We focused on analyzing general refinancing patterns in the U.S. housing market. To that end, we utilized a mix of proprietary and publicly available data sources including information on the financial structure of mortgage loans and borrowers’ attributes. Our analysis is based on a sample of matched CoreLogic Property and Tax Deed data and Home Mortgage Disclosure Act (HMDA) records. CoreLogic compiles real estate transaction data from tax forms and deed records, covering nearly the entire universe of U.S. mortgages. CoreLogic’s microdata provide a comprehensive and detailed view of mortgages, including transaction dates, lien types, loan types, interest rates, and property characteristics, among other things. To gain insights into household characteristics, such as race and income reported at the time of application, we supplemented CoreLogic with HMDA data. HMDA requires financial institutions originating closed-end mortgages or open-end lines of credit to report annually on their mortgage activity.1 We utilized the linkage between HMDA and CoreLogic to create a panel of mortgage financings by chaining observed refinances to previous financing activity over time.
We matched HMDA and CoreLogic records using a similar process as that used by Goodman et al. (2018). Our harmonized sample includes mortgage records matched on several criteria, including origination year, loan type, census tract, and a string comparator score that maximizes similarity in lender names. Following this matching routine, we obtained a dataset containing possible matches at the property level, assuming that a sequence of loans made on a particular property belongs to the same homeowner if certain conditions are met. We found potential matches for 60 percent of the CoreLogic property-level records. However, after reconciling instances of many-to-one matches and implementing conservative matching rules to reduce false positives, our match rate was reduced to 33 percent. Further information on our matching procedure can be found in the appendix.2
To understand refinancing patterns, it is essential to identify a sequence of mortgage financing transactions that are likely held by the same homeowner. This process allows us to assess changes in mortgage affordability by linking recent refinances to interest rate conditions that existed before refinancing. To achieve this goal, we created a base sample that includes 6.5 million refinances with linked mortgage sequences, where the most recent first-lien mortgage loan is credibly linked to previous financing events of either a purchase or other refinance. As this report focuses on homeowners’ liquidity preferences and responsiveness to monetary policy rather than their home equity extraction, we focused our analysis on the 1.1 million rate-term refinances present in Sample 2 and excluded cash-out transactions. Additionally, we used this secondary panel to determine the extent of refinancing inertia across racial groups. Using these different sample configurations, we calculated changes in monthly payments, estimated interest expense savings, and analyzed differentials in closing cost burdens. Additional details on the samples used can be found in Table 1.
Table 1: Data Asset Overview
CoreLogic and Public HMDA data |
|
CoreLogic-HMDA Base Merged Sample 37.5 million matched first-lien mortgage loans 3 |
|
Purpose: Examine long-run refinancing trends Mortgage liens refinanced between January, 2007 and December, 2021. Matched any type of refinance loan where a preceding lien is identified in CoreLogic and both records are matched to HMDA.
|
Purpose: Estimate COVID-19 refinance incentive and benefits of refinancing Fixed-rate mortgage liens active between March, 2020 and December, 2021 that either refinanced or had an incentive to refinance. All mortgages have a high-confidence match to a HMDA record. Interest rate is reported on all mortgages, including preceding first liens for observed refinances. 2.4 million records |
Homeowners of color face disproportionate income shocks, higher credit costs, and unequal exposure to mortgage products due in part to discriminatory lending practices and longstanding institutionalized disadvantage (Park, 2021).4 In theory, Black and Hispanic homeowners would have greatly benefitted from the historically low interest rates during the COVID-19 pandemic if they refinanced at a similar or higher rate than other homeowners. Measuring the extent to which different household groups took advantage of the early COVID-19 pandemic interest rate changes to manage their liquidity needs can shed light on the role that race plays in mediating access to the monetary policy transmission channel.
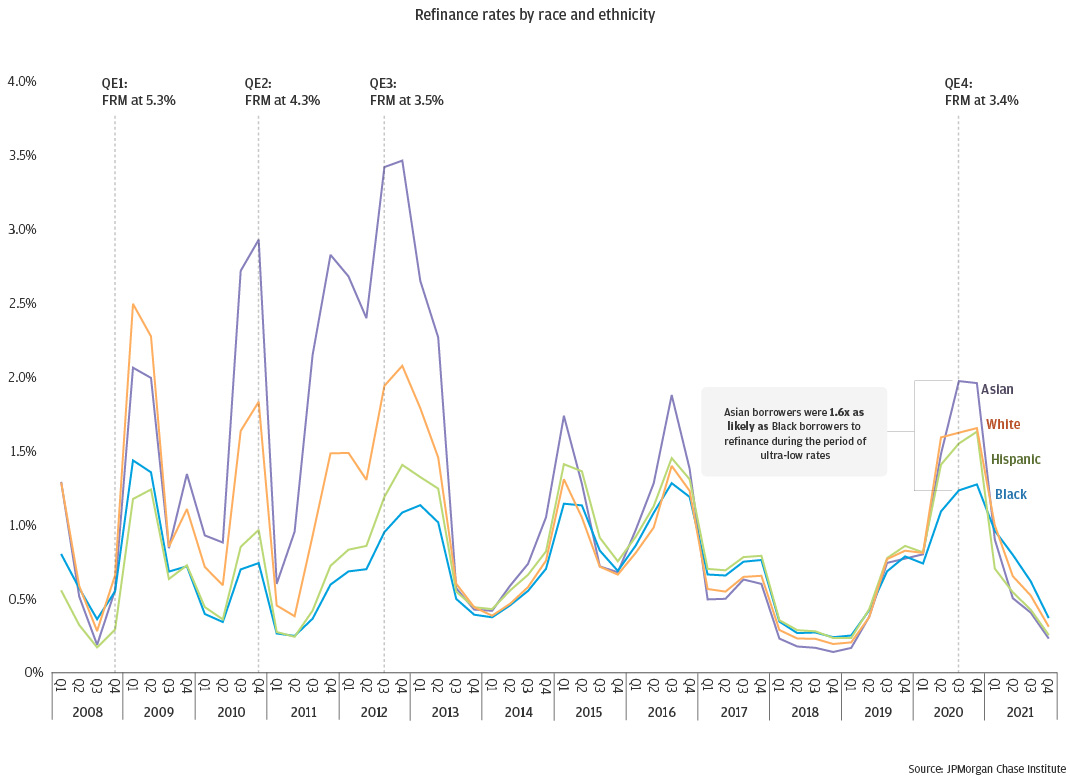
To determine if the response to declining interest rates differed based on demographic or economic status, we analyzed refinancing rates by race, ethnicity, and income. Figure 1 illustrates quarterly refinancing rates from 2008 to 2021, indicating the probability of refinancing during a given quarter across racial groups. In general, Asian and White borrowers experienced the highest refinance rates throughout all quarters, while Black and Hispanic borrowers typically had lower refinance rates. The peaks in refinancing coincide with key economic moments such as the 2007/2008 financial crisis recovery, the launch of the third round of quantitative easing in 2012 to promote job growth, and the economic impact of the pandemic.
COVID-19 refinancing reached its zenith in late 2020 for all racial groups, with the highest rates of refinancing occurring in Q3 and Q4. Asian borrowers exhibited the highest average refinance rate, followed by White, Black, and Hispanic borrowers. The refinance rate for Asian borrowers peaked at 2.0 percent in 2020-Q3, while White borrowers achieved their 1.7 percent refinancing high point in 2020-Q4. Conversely, peak refinancing rates for Black and Hispanic borrowers were considerably lower, with peaks of 1.3 percent and 1.6 percent, respectively, as both groups trailed in their response to the sharp drop in interest rates. While the refinancing disparities between White and Hispanic or Black borrowers were significant, they were even more pronounced when comparing the latter groups to Asian borrowers. For instance, from the second quarter of 2020 to the first quarter of 2021, Asian borrowers were 1.5 times more likely to refinance their homes than Black borrowers (refinancing rates of 1.6 percent and 1.1 percent, respectively). We observed a similar trend for Hispanic borrowers, although the difference was slightly less pronounced.
Figure 1: Wealth gains from the COVID-19 refinance boom were unevenly distributed; Black homeowners saw the least benefit from low interest rates.
When it comes to responding to changes in headline mortgage rates, Black borrowers appear less likely to react. In fact, their responsivity lags sharply behind that of other groups, particularly when interest rates started to decline in early 2020. It is important to highlight that Black and Hispanic borrowers had the highest rates of home refinancing during COVID-19 compared to any other time since the subprime crisis. In 2020-Q4, Black homeowners saw their refinancing rates peak at 1.3 percent, whereas Hispanic borrowers achieved a record refinancing rate of 1.6 percent. During the COVID-19 refinance wave, Hispanic homeowners were notably active, with their refinance rates 33 percent higher than those seen during the peak financial crisis years (1.6 percent compared to 1.2 percent). While Black homeowners also reached record highs during this period, their rates lagged those of their Hispanic and Asian counterparts.
When examining refinancing rates with an income lens, the disparities become more evident. Borrowers in the upper-income quartile, with yearly incomes exceeding $75,000, were 2.2 times more likely to refinance than those in the lowest quartile, earning less than $50,000 annually (0.5 percent compared to 1.1 percent).5 This considerable divide suggests that higher-income borrowers were more likely to capitalize on the benefits of refinancing, such as reducing high-interest-rate loans and enhancing their financial stability through reduced mortgage payments. Our findings echo those of other studies that have analyzed refinancing outcomes and found greater refinancing propensities among higher-income and White borrowers compared to Black, Hispanic, and less affluent borrowers (Gerardi, Lambie-Hanson, and Willen, 2021; Agarwal et al., 2021).
Our descriptive analysis does not account for other factors that impact creditworthiness, such as credit scores, total debt levels, or liquid assets. These factors, along with income, impact refinancing accessibility and might contribute to the observed disparities among economic and demographic groups. Despite this limitation, our unadjusted disparities are significant and likely influenced by widespread employment disruptions within these communities. The COVID-19 pandemic’s disproportionate effects on Black and Hispanic communities are well-established, with many diverse households suffering permanent job losses, the loss of primary breadwinners, and higher rates of COVID-related health disparities (Cortes and Forsythe, 2023; Parolin and Lee, 2022). Consequently, the pandemic’s adverse impact on employment within diverse communities may have led many Black and Hispanic homeowners to experience reduced access to essential credit resources, including mortgage loans. Additionally, their disproportionate participation in forbearance payment deferrals affected their ability to refinance. Although federal agencies substantially reduced entry barriers to their COVID-19 forbearance programs, these programs made access to refinancing challenging. Refinancing eligibility was subject to various restrictive conditions, such as clearing waiting periods if borrowers missed payments, making contractual payments while in forbearance, or making a minimum of three consecutive payments after exiting forbearance.
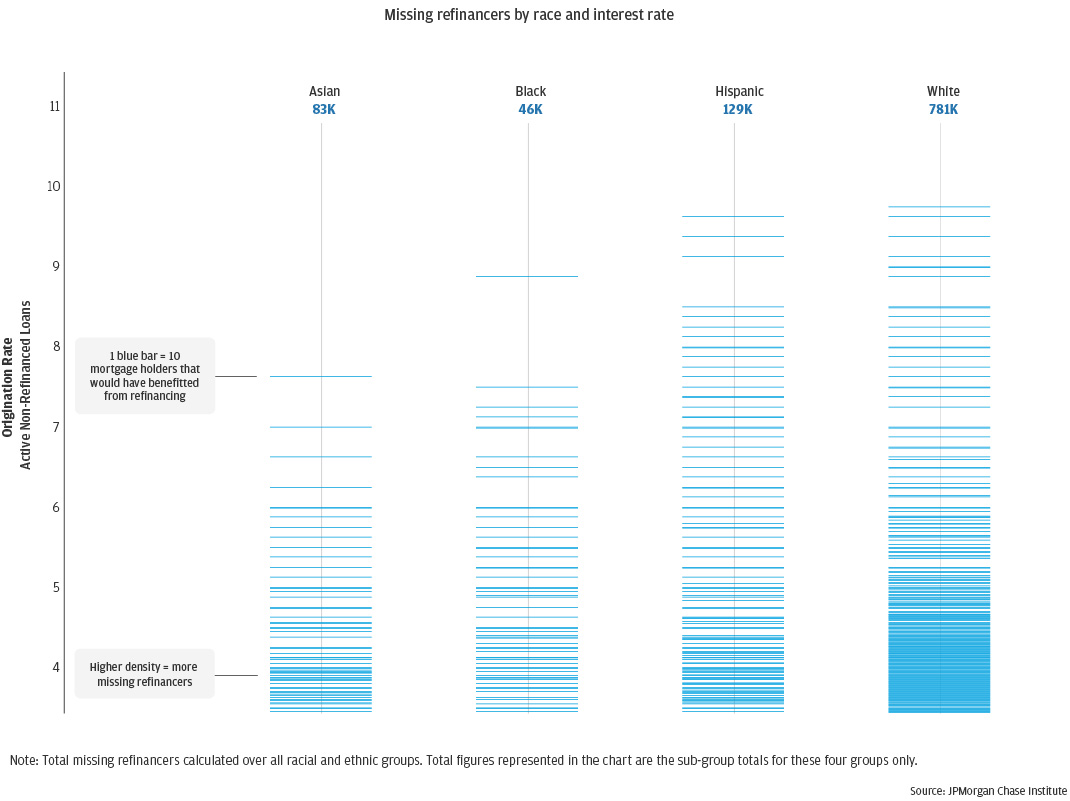
Although some homeowners may have been ineligible for refinancing due to loss of income, poor credit scores, high debt levels, or small principal balances, we estimated that millions of eligible borrowers missed the opportunity to refinance into more affordable mortgages. To estimate the population of missing refinancers that were in-the-money 6 during the COVID-19 window but missed the refinance boom, we first identified a subset of borrowers in our base sample most likely to refinance—those with a maximum loan-to-value ratio of 80 percent; a minimum outstanding loan balance of $50,000; at least ten years remaining on the term; and a loan age greater than 12 months. Within this sample, we identified borrowers whose note rate was sufficiently higher than the average Freddie Mac Primary Mortgage Market Survey (FRPMMS) 30-year fixed mortgage rate (3.0 percent) over our COVID-19 window to suggest an incentive to refinance. We assessed this incentive using two approaches.
Our first, more expansive approach, compared note rates to FRPMMS using the general guideline that most borrowers need a new rate that is at least 75 basis points lower than their note rate to be incentivized to refinance. This rule of thumb difference factors in the present value of refinance-driven savings as well as the related costs. By this logic, we identified 1.4 million homeowners who had an incentive to refinance but missed the COVID-refi boom.
In our second, more conservative approach, we consider borrower credit risk, which is crucial in determining loan pricing and credit eligibility. Borrowers with lower credit scores are usually subject to higher loan rates than those with higher scores, so they need a reasonable margin between their higher old mortgage rates and the new rate to incentivize them to refinance. To address this, we computed a borrower-level risk premium as the difference between the borrower’s origination rate and the prevailing FRPMMS rate at the time of origination. We then add 75-basis points to the risk premium to account for additional service costs not driven by idiosyncratic borrower risk. Using this alternative approach, we estimated that 1.2 million missing refinancers could have benefitted from refinancing into more affordable mortgages but did not.
Figure 2: Missing Refinancers held substantially higher mortgage rates, suggesting considerable liquidity savings left on the table
The 1.2 million missing refinancers, depicted in Figure 2, make up 51 percent of our sample of homeowners who were in-the-money and could have benefitted from refinancing during the COVID-19 pandemic, but did not. Meanwhile 31 percent of homeowners opted to monetize their refinance options into a rate or term refinance, shaving an average 117 basis points off their mortgages. The median interest rate among the missing refinancer segment was 4.5 percent, with Black and Hispanic non-refinancing households holding on to mortgages with the highest average interest rates of 4.9 percent and 4.6 percent, respectively. Life events such as an impending move, an expected layoff, ongoing delinquency, or opting for a COVID-19 payment deferral program due to income disruption all shape a household’s decision to refinance during the pandemic. However, these factors alone may not fully explain the significant number of estimated missing refinancers. This finding is consistent with a large body of literature that has reported delayed refinancing behavior in favorable market conditions and the wealth-building consequences that result from such refinancing inertia.
As previously mentioned, two essential drivers of the decision to refinance are reductions in monthly payments and the change in the remaining mortgage term. Improved liquidity results in more disposable income each month, whereas reduced mortgage terms accelerate the pace at which homeowners accumulate equity. To better understand the differences in refinancing characteristics among racial groups, we divided rate-term refinancers into three groups based on how their loan terms and monthly payments changed: Liquidity Seekers, Equity Builders, and Liquidity Seeker & Equity Builders.
This simple classification scheme differentiates households focused on improving their liquidity positions from those seeking to accelerate equity accumulation during the economic downturn. The “Liquidity Seekers” group, which accounted for 81 percent of rate-term refinancers, consisted of households that refinanced to improve their liquidity positions by lowering their monthly payments.7 Liquidity Seekers reduced their monthly mortgage payments by lowering borrowing costs and extending their loan terms. On the other hand, the “Liquidity Seeker & Equity Builder” group, which comprised 4 percent of all refinancers, reduced their monthly mortgage payments while shortening their loan terms. Finally, the Equity-Builder group, representing 13 percent of our rate-term refinancers, opted to accept higher monthly mortgage payments in exchange for the opportunity to accumulate equity faster by refinancing into shorter-term mortgages and reducing total interest cost.
The presence of Equity Builders, whose monthly payments increase after refinancing, has implications for the aggregate spending impacts of refinancing. While Equity Builders likely had fewer asset constraints, they may need to decrease their discretionary spending in order to finance their more rapid loan pay down. Because 15-year mortgage rates are typically 50 basis points lower than 30-year mortgage rates, reducing the loan term allows borrowers to reduce their interest rate, even if they would not ordinarily have much to gain from refinancing without the term change. However, this implies that households who refinance in this way must make higher monthly payments to access these interest savings, which reduces the amount of discretionary income available for spending and may actually constrain, rather than stimulate, aggregate spending.
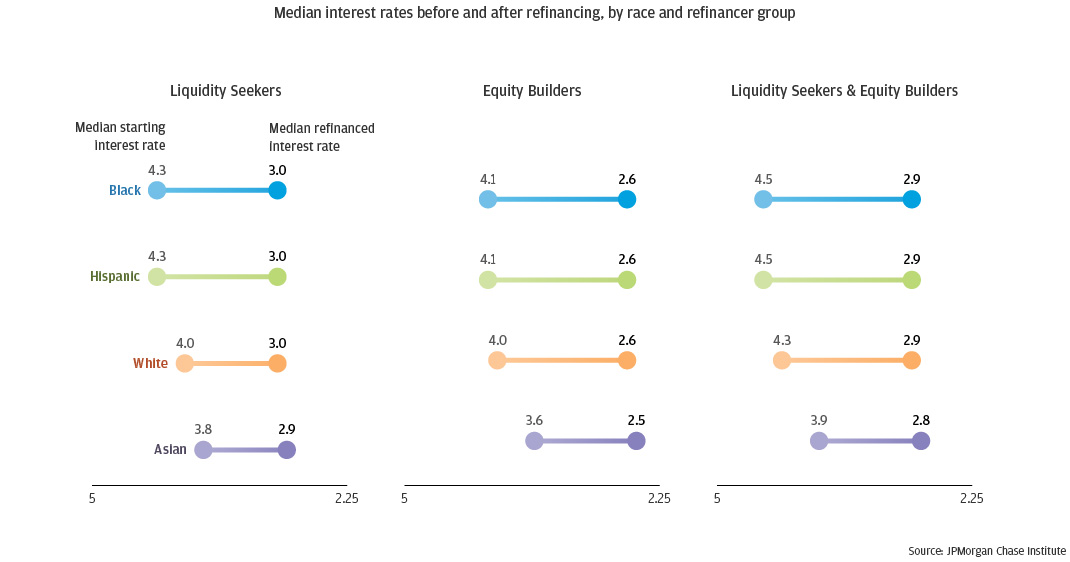
As Figure 3 illustrates, Black households in the Liquidity Seeker category saved the most on their mortgage rates, with a median reduction of 125 basis points. In comparison, Hispanic refinancers reduced their mortgage rates by a median of 113 basis points. On the other hand, the average White borrower’s mortgage rate decreased by 100 basis points, while the median Asian borrower experienced an 82-basis point decline in their mortgage rate. Before refinancing, the median interest rate for Black and Hispanic borrowers in the Liquidity Seeker group was 4.3 percent, compared to 3.8 percent and 4.0 percent for Asian and White borrowers, respectively.
Black and Hispanic borrowers may have experienced larger interest rate reductions when refinancing their mortgages due to their mortgages having higher interest rates, to begin with. Lower uptake in refinancing opportunities results in an accumulation of higher interest rates over time with negative impacts on wealth building and financial health. This is especially problematic for Black and Hispanic homeowners, who are more likely to face challenges in accessing mortgage credit and therefore unable to benefit fully from refinancing. The buildup of higher interest rates in the mortgage portfolio held by Black and Hispanic families may have motivated these households to refinance at higher rates during the COVID-19 window than in previous periods and likely contributed to the significant interest rate savings. Despite this positive development, many Black and Hispanic homeowners did not recognize or take advantage of the refinancing incentive. The persistence of refinancing inertia among these households can have negative financial consequences and contribute to the racial wealth gap widening (Gerardi, Willen, and Zhang, 2020).
Figure 3: Because Black and Hispanic borrowers started with higher-interest mortgages, they realized larger percent savings in refinanced rates
Following refinancing, there was a notable decrease in interest rate differentials across racial groups. The median interest rate for Black, Hispanic, and White Liquidity Seekers dropped to 3.0 percent, while Asians retained a slight advantage at a 2.9 percent rate. Refinancers belonging to the Equity Builder and Liquidity and Equity Builder segments also experienced substantial interest rate reductions. Black and Hispanic borrowers in these groups saw larger rate drops than White and Asian borrowers, primarily due to their initial interest rates. The narrowing of racial disparities in interest rates due to COVID-19-related monetary policy measures implies that monetary policy can mediate the racial wealth divide. However, the large disparities in homeownership influence the extent to which reduced interest rates moderate the racial wealth gap (Bartscher et al., 2022).
Homeowners who opted to refinance and reduced their interest rates reaped considerable savings. For example, Liquidity Seekers reduced their monthly payments by about $200, while Liquidity and Equity Builders saw a modest median monthly payment decrease of $80. Conversely, mortgage payments increased for Equity Builders as they significantly shortened their loan terms by about nine years, leading to a median monthly mortgage payment increase of $240. The fact that Equity Builders increased their housing expense burden during a period of extraordinary uncertainty suggests they felt more confident about their financial outlook than Liquidity Seekers, who had the lowest median incomes. We do, in fact, see that Equity Builders had a median income that was 8.1 percent higher than other groups. The lowest pre-refinance interest rates and locked-in prime rates on their refinanced mortgages ranged from 2.5 percent to 2.6 percent, which were roughly equivalent across racial groups.
Decreasing mortgage payments can improve financial stability as housing expense burdens become more manageable. For instance, Black and Hispanic Liquidity Seekers saw median payment decreases of $191 and $205, respectively, which, when annualized, represent significant payment savings and a marked improvement in housing affordability. For instance, a Black or Hispanic household earning $90,000 could save anywhere from $2,292 to $2,460 in mortgage payments, equivalent to 2.4 to 2.7 percent of their yearly income every year that they remain in their mortgage. Reduced housing costs suggest that households who were previously struggling to keep up with payments may now find it easier to afford their homes.
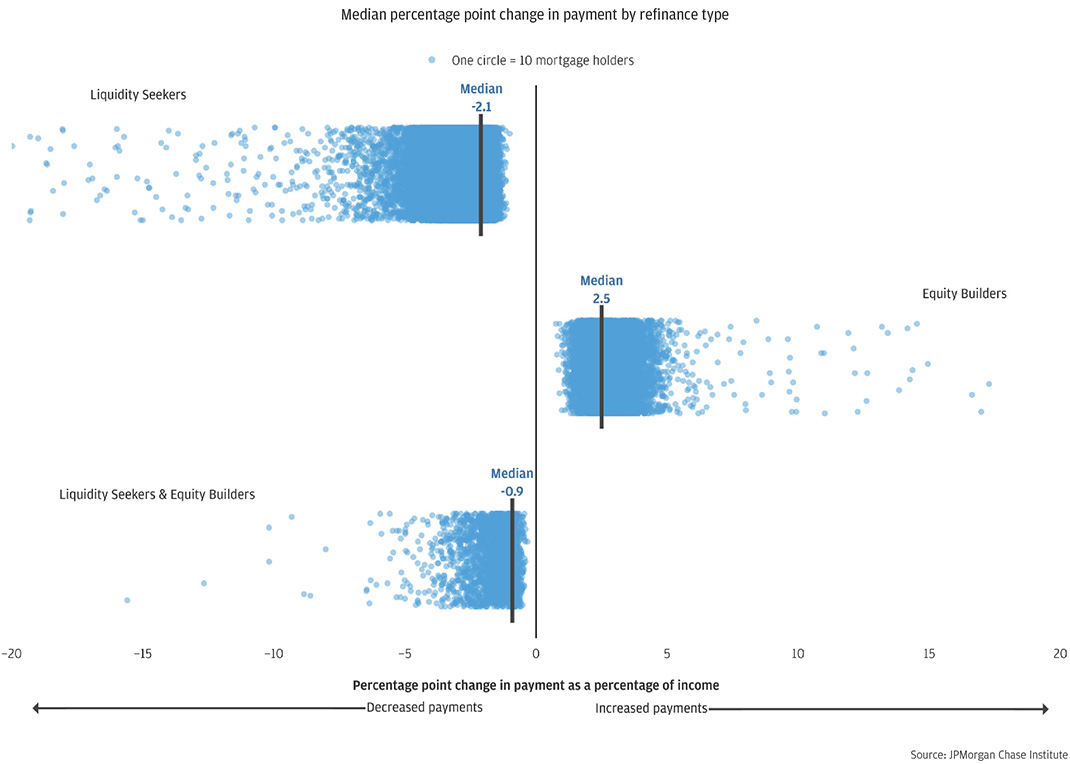
We analyzed changes in payment affordability by evaluating shifts in median payment-to-income ratios.8 The results, presented in Figure 4, reveal that Liquidity Seekers experienced considerable improvements in affordability, with their median payment-to-income ratio decreasing by roughly 2.1 percentage points. This equates to a 14 percent improvement in mortgage affordability, as the share of income allocated to mortgage payments decreased for Liquidity Seekers, with their median post-refinance burden ratio declining from 17.8 percent to 15.3 percent. Notably, Black and Hispanic Liquidity Seekers benefitted most from these gains in affordability, as their median payment-to-income ratios declined by 2.4 and 2.5 percentage points, respectively. These decreases correspond to a 14.6 and 14.1 percent improvement in mortgage affordability for the average Black and Hispanic liquidity seeker.
Meanwhile, Asian and White borrowers experienced similar affordability gains of 12.5 percent and 13.9 percent, respectively. These reductions in payment burdens offer financial relief to homeowners, who can now redirect the extra disposable income to discretionary spending, debt repayment, or savings. It is worth emphasizing that the risk of defaulting and falling into delinquency could substantially decrease for liquidity-constrained borrowers who may find it easier to manage mortgages in the face of economic certainty (Abel and Fuster, 2021).
Figure 4: Liquidity Seekers reaped significant savings during the COVID-19 refinance boom
Regarding wealth building, the savings from refinancing can be seen as flexible cash flows that homeowners can invest to accumulate wealth over time. For both Liquidity Seekers and Liquidity Seeker & Equity Builder groups, these savings accumulate gradually. Consequently, we gauge the wealth-building potential by discounting the cash flow streams after accounting for refinancing expenses. For Liquidity Seekers, assuming they hold their new mortgage rates for ten years, the net present value of their median monthly payment savings would amount to $20,043.9 Conversely, on average, Equity Builders experienced a 2.1 percentage point increase in their monthly payments.
Despite the significant increase in payments, these refinancers gained tremendous interest cost savings as a larger portion of their payments now go toward principal repayment rather than interest expenses. Over a decade, the median Equity Builder’s net present value interest savings would amount to $14,582, while we estimated that their median accumulated equity from rapid principal payment would total $67,214. These savings, both interest and payment reductions, are considerable, especially when viewed in the aggregate. For instance, over ten years, Liquidity Seekers’ total net present value of payment savings would climb to $11.7 billion, while Equity Builders would achieve a combined net present value interest savings of $1.3 billion and $6.2 billion in tappable equity.10
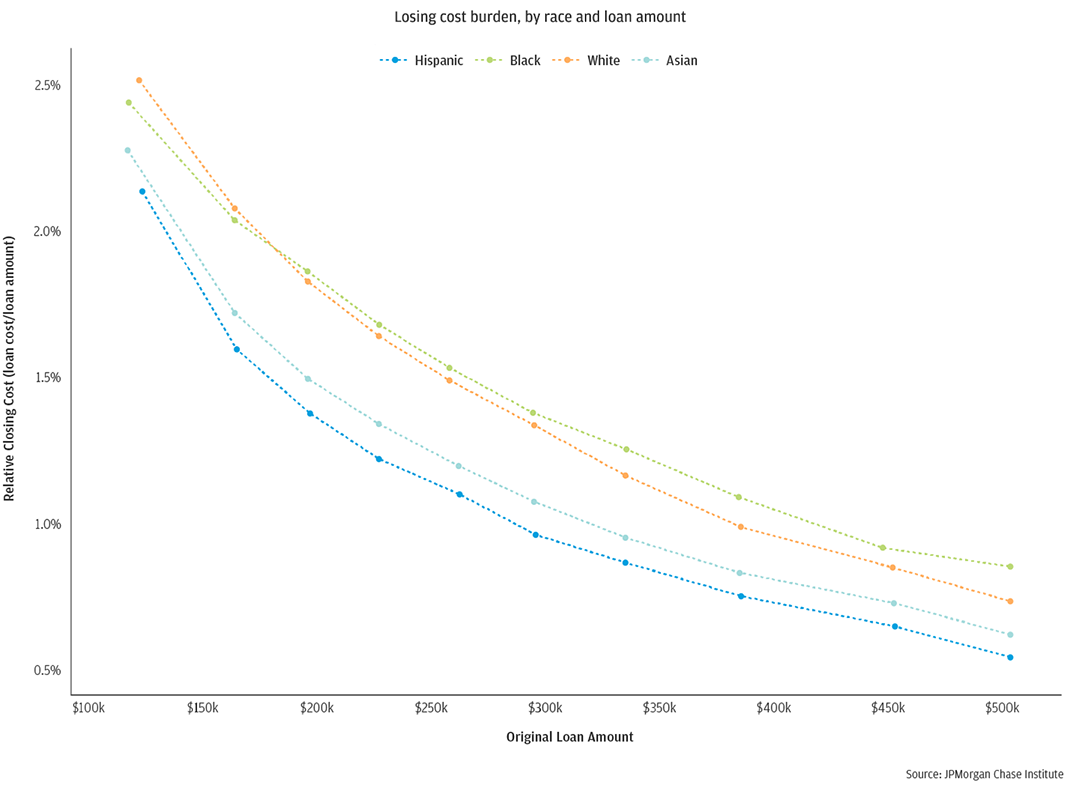
Many homeowners miss out on refinancing opportunities due to various constraints, such as having insufficient liquid assets to pay closing costs. We took advantage of HMDA’s expanded data reporting standards to gather information on closing cost expenses. This data enabled us to investigate differences in closing cost burden among various racial groups and understand how these differences affected refinancing rates. In addition to comparing costs in terms of dollar amounts, we calculated burden as a percentage of the loan amount to account for the non-proportional increase in closing costs as loan size increases (Brevoort, 2022). Closing costs, such as title insurance and appraisal fees, constitute a substantial share of settlement costs. These elements are generally priced as a fixed cost and can be excessively expensive for borrowers with smaller loan balances (Brevoort, 2022). Due to the fixed pricing of these expenses, refinancing can be financially unattainable for many borrowers, especially those facing liquidity constraints and holding smaller loans.
As depicted in Figure 5, Black and Hispanic borrowers bore greater closing cost burdens than Asian and White borrowers. This trend was consistent across different loan amounts, meaning that for loans ranging from $100,000 to $125,000, Black and Hispanic borrowers typically paid median closing costs that were approximately 2.5 percent of the loan amount, compared to 2.3 percent for White borrowers with similar loan amounts. This translates to a difference of $204 and $407 in upfront financing fees for Black and Hispanic homeowners, respectively, relative to White homeowners. Differences in loan balances and variations in closing cost drivers contributed to the absolute dollar differences between Black and Hispanic borrowers.
Figure 5: Black and Hispanic borrowers faced higher closing costs to refinance relative to Asian and White borrowers, most acutely at smaller loan amounts.
As illustrated in Figure 5, the burden of closing costs declines as loan amounts rise. Borrowers with loan balances below $120,000 face closing cost ratios 2.5 times greater than those with balances of $420,000 or more (2.3 percent compared to 0.9 percent), despite their median balances being 3.5 times smaller. Most refinances in our data originated within the past 5 to 7 years, suggesting that these low balances are more likely a result of limited purchasing capacity rather than long-standing mortgages. Our sample has a higher representation of Black refinancers at the low end of the loan distribution compared to all other groups, implying that low balances may pose additional challenges for this group. To encourage these homeowners to refinance, a substantial interest rate reduction is needed to counterbalance the regressive nature of closing costs. Without an adequate incentive, their refinancing rates will probably remain low.
Closing cost disparities were also evident for midsized loans. In this region, the closing cost burden for Black and Hispanic borrowers was 26 percent higher than that of Asian borrowers (1.6 percent compared to 1.2 percent). The unadjusted White-Black and Hispanic disparity was slightly smaller at 19 percent. Monetary differentials are larger in this range; for instance, Black homeowners pay an average of $1,066 more than Asian borrowers with the most favorable terms. The Hispanic-Asian differential was marginally smaller at $969. It is worth noting that while Hispanic and Black homeowners have similarly sized mortgages, the latter faced systematically higher fees. Racial cost imbalances are also apparent at even larger loan amounts, as Black and Hispanic borrowers pay $800 and $704 more in closing costs compared to White borrowers.
It is worth considering whether other identifiable borrower or loan characteristics that affect loan costs could account for these disparities. To explore this question in a preliminary manner, we used HMDA’s debt-to-income data as a crude approximation for borrower credit scores. We found minimal variation among racial groups, implying that Black and Hispanic borrowers paid more for Asian and White borrowers for the same services. While our analyses do not consider all borrower or loan characteristics that influence loan costs, our findings align with more extensive comprehensive studies examining fee-based disparities. One revealed that Black borrowers paid an additional $1,211 in total loan costs for conventional rate refinances than White borrowers, while the Hispanic-White cost differential was $394 (Popick, 2022).
Other factors unmeasured in this study with respect to pricing and fees, such as variations in title insurance premiums and products, variations in appraisal fees and products, pricing and fee variation by lender type and product type, determination to engage a mortgage broker, and application of lender credit discretion, could also significantly impact the price of settlement services and the closing cost burden. Recent research has shown that even after controlling for factors such as credit and indebtedness, lenders tended to offer pricing menus to Black and Hispanic borrowers that differed from those offered to White borrowers (Zhang and Willen, 2021). Our findings are consistent with the view that Black and Hispanic borrowers either face different cost schedules than Asian and White borrowers or they use different strategies when shopping for loans.
Historic surges in inflation and the resulting monetary policy response have reduced the market for refinancing. As of June 2023, prime mortgage benchmark rates have risen to 6.7 percent, making refinancing costly for most borrowers. Nonetheless, fresh refinancing prospects would emerge should inflation subside sufficiently to allow the rates in the mortgage market to reduce to levels that would again make refinance a viable financial opportunity for savings. We present evidence that reduced interest rates lead to household wealth gains that refinancers may convert to additional consumption or long-term savings. However, our analyses indicate that during the COVID-19 refinance boom, Black and Hispanic borrowers were less likely to refinance than White and Asian borrowers. The absence of eligible Black and Hispanic borrowers from the refinancing market indirectly subsidizes White and Asian borrowers, who refinance more frequently and obtain lower interest rates (Fisher et al., 2022; Gerardi et al., 2020).
The refinancing disparities, detailed in our study and other research, underscore the uneven distributional impact of monetary policy and its downstream effects on homeowner financial stability. Policymakers and private sector leaders should seize the market downturn as an opportune moment to design innovative solutions that alleviate refinance barriers for Black, Hispanic, and low-income homeowners.
Federal housing finance agencies should broaden mission-based programs to enhance refinance accessibility. We found that Liquidity Seekers enjoyed significant payment savings, while a considerable share of potential refinancers missed the opportunity to refinance during the COVID-19 pandemic. Refinancing inertia disproportionately impacts those who can least afford it. Federal agencies can play a crucial role in bridging refinancing gaps by adopting a more proactive approach to enhancing refinancing accessibility, particularly for low-income homeowners. To accomplish this, the Federal Housing Administration (FHA) could reevaluate its approach to closing costs in streamline refinances, allowing borrowers to include closing costs in loan balances while implementing guardrails to ensure tangible payment savings and protect against predatorial practices.
Concurrently, the Federal Housing Finance Agency (FHFA) could broaden its enterprise special purpose credit program (SPCP) commitment by developing a streamlined, lower-cost rate-term refinancing program targeting Black, Hispanic, and low-income borrower segments. FHFA could consider an SPCP refinance program which incorporates design elements to reduce non-value-added overhead costs that pose barriers for consumers. This design strategy could include increased usage of appraisal waivers in appropriate majority-minority markets and enabling digital verification of income and payment histories without undermining ability-to-repay guardrails but reduce administrative underwriting costs for borrowers with established performance trajectories. By prioritizing these policy adjustments, both FHA and FHFA would enhance the accessibility of refinancing for Black and Hispanic homeowners, as well as make refinancing economically feasible for those with small loan balances. Such enhancements would consequentially bolster their financial resilience.
Lenders should consider developing targeted programs that maximize access to affordable refinancing and lower closing costs for homeowners with limited means. Our research indicates that Black and Hispanic borrowers refinanced at significantly lower rates and faced substantially higher closing costs relative to their loan sizes, particularly for smaller loans. To address this issue, lenders could create a lender-specific SPCP refinance product that employs predictive analytics and leverages borrower-level data to identify Black and Hispanic borrowers who would benefit from rate-term refinancing. By digitally evaluating potential ability-to-repay, net payment reductions, and interest savings to customize low-cost solicitation offers tailored to borrowers’ financial situations, lenders could reduce frictions and better serve these homeowners. Additionally, lenders could consider cost effective title insurance alternatives that provide meaningful cost relief for financially constrained borrowers. The SPCP framework offers lenders considerable flexibility in product design. When combined with agency-approved appraisal waivers or alternative lower-cost appraisal methods, lenders could ensure tangible payment reductions and significantly reduce non-value-added administrative costs. The regulatory incentive inherent in the SPCP framework has the potential to encourage lenders to proactively promote refinancing among Black and Hispanic borrowers, ultimately enhancing their financial stability.
Lenders and servicers can develop borrower engagement programs that effectively convey the benefits of refinancing to homeowners, enhancing their understanding of its importance. The success of products and services aimed at increasing access to refinancing depends on active borrower participation. Lenders and servicers could create targeted messaging campaigns that raise awareness about refinancing benefits and encourage borrowers to take advantage of opportunities to reduce payments as they arise. Timely, personalized prompts in simple, understandable language can help borrowers grasp the potential savings and evaluate costs, enabling them to make better financial decisions. Incorporating digital money management apps and behavioral sciences insights into product designs may boost refinancing participation among low-income, Black, and Hispanic households. Behavioral research indicates that payment-sensitive consumers respond to interest rate signals when they receive repeated reminders about rate changes and have sufficient time to act (Zhang et al., 2019). By utilizing digital innovations to authentically engage with borrowers for the sole purpose of promoting their financial well-being—emphasizing the wealth-building advantages of refinancing or translating interest rate changes into tangible, relevant benefits specific to their financial situations—lenders can foster consumer trust more broadly.
Policymakers should remain vigilant to the effects of the mortgage refinancing channel on wealth-building opportunities for homeowners. The wealth portfolios of Black and Hispanic homeowners are qualitatively different from those of White and Asian homeowners, with a significant share of their wealth and assets concentrated in their homes. This skew emphasizes the need for enhancing access to mortgage refinancing, which is vital for preserving their homeownership gains and broadening avenues to wealth building. While we have underscored the benefits of greater mortgage payment affordability and wealth building, we acknowledge that homeownership is more than just a financial asset. It offers families a sense of belonging, stability, and control. The low refinancing rates among low-income, Black, and Hispanic homeowners highlight the pressing need for initiatives that promote refinancing as a strategy to address the racial wealth gap.
A. Merging HMDA and CoreLogic
CoreLogic is a commercial data aggregator that specializes in furnishing property data products. The CoreLogic deed data used in this analysis provides nationwide coverage of residential properties and the evolution of financing activity associated with each parcel. We combined CoreLogic’s longitudinal parcel-level data with publicly available HMDA data because the former data source does not include information on borrowers’ characteristics, such as race and income. We matched parcel data from CoreLogic on mortgages active between 2007 and 2021 to annual HMDA in each of those years.
We parsed the HMDA data to include purchase and refinance mortgages, as designated by the “loan action type” field. Following the methodology of Goodman, Bai, and Li (2018), we probabilistically matched CoreLogic and HMDA data using an array of loan characteristics with high levels of agreement: census tract, origination year, occupancy type, lien type, loan type, loan purpose, loan amount, and lender name. To increase the accuracy of our match rate and reduce the occurrence of many-to-one matches, we set a similarity threshold for loan amounts of no more than $3,000. Requiring a unique match on loan amounts proved too restrictive and did not account for expected differences between the two data sources due to rounding or other sources of error. This first stage in our matching procedure resulted in an average 60 percent potential match rate across all years.
Agreement between lender names was crucial in establishing confident one-to-one matches. To address differences in lender names, we used the Levenshtein ratio, a widely used string matching algorithm that measures the similarity between strings. The score ranges from 0 to 1 and reflects the number of transformations needed to make two strings equivalent, with a higher score indicating greater string similarity. We considered records with a Levenshtein score greater than 0.65 reasonable matches in lender names. This second stage preprocessing procedure yielded an average 41 percent confident match but does not fully resolve the instances of many-to-one matches. In constructing the final sample, we first selected records with clean one-to-one matches, followed by selecting the match with the highest Levenshtein score among records with multiple potential matches. All other records were dropped. The final sample included 37.5 million records with an average 33 percent unique match rate across all years.
We conducted several validation tests to confirm the accuracy of our sample matches. We randomly selected samples and manually confirmed the match results. We also performed cross-checks on lender and MSA distributions between our sample and the full HMDA dataset, which showed high correspondence between the two. Additionally, we used a blocking strategy to evaluate the sensitivity of our results to our preference for the highest Levenshtein score by randomly replacing selected matches with alternate matches when multiple options were available. Finally, we carried out subsequent sensitivity tests by varying loan amount difference and Levenshtein ratio thresholds, which confirmed the consistency and robustness of our results.
B. Discounting Present Value of Mortgage Savings
Typically, when a borrower refinances into a mortgage with a lower interest rate, their monthly mortgage payment decreases. This extra disposable income can serve as supplementary liquidity, which can be saved or spent. The increased cash flow are future mortgage savings, however, the magnitude of these savings streams depend on size of the rate decrease or changes in loan term or amount financed. The potential for wealth building arising from refinancing is most evident if the borrower saves these cash flows over time.
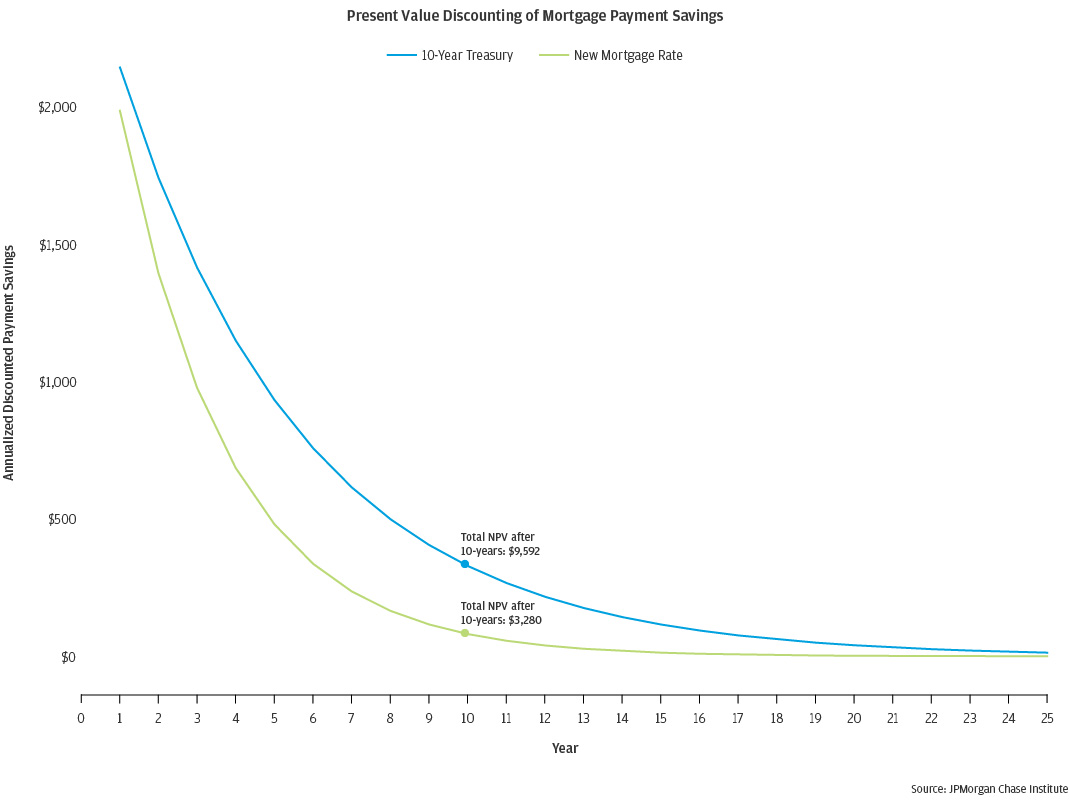
Since borrowers realize these cash flow savings over an extended period, the payment streams must be adjusted to ascertain the total value of wealth gained in present value terms. We used a discount rate that reasonably represents the return a borrower could anticipate from a comparable low-risk investment to discount the payment savings. In this analysis, we use the average 10-year U.S. Treasury for the period between March 2020 and December 2021 as a nominal discount rate, which stood at 1.15 percent. Alternatively, the refinanced mortgage rate could also serve as a discount rate, as it conceptually represents a reasonable current borrowing cost. Suppose a borrower refinances a 30-year fixed-rate mortgage (FRM) five years after its origination. The interest rate on the previous loan was 4.0 percent and the new rate is 100 basis points lower. At time of refinancing, the unpaid principal balance amounts to $300,000. The borrower chooses a 30-year FRM, incurs $3,000 in closing costs, and sees a monthly payment reduction of $200. Figure A1 demonstrates the impact of each discount rate on the present values of the borrower’s payment savings.
Figure A1
Abel, Joshua, and Andreas Fuster. “How do Mortgage Refinances Affect, Debt, Default, and Spending?” Evidence from HARP.” American Economic Journal: Macroeconomics 13.2 (2021): 254-291.
Agarwal, Sumit, Souphala Chomsisengphet, Hua Kiefer, Leonard C. Kiefer, and Paolina C. Medina. "Refinancing inequality during the COVID-19 pandemic." Available at SSRN 3750133 (2021).
Bartscher, Alina K., Moritz Schularick, Moritz Kuhn, and Paul Wachtel. "Monetary policy and racial inequality." Brookings Papers on Economic Activity 2022, no. 1 (2022): 1-63.
Beraja, Martin, Andreas Fuster, Erik Hurst, and Joseph Vavra. "Regional heterogeneity and the refinancing channel of monetary policy." The Quarterly Journal of Economics 134, no. 1 (2019): 109-183.
Brevoort, Kenneth P. "Do Low Mortgage Balances Limit Refinancing Opportunities?." Available at SSRN 4163151 (2022).
Cortes, Guido Matias, and Eliza Forsythe. "Heterogeneous labor market impacts of the COVID-19 Pandemic." ILR Review 76, no. 1 (2023): 30-55.
Di Maggio, Marco, Amir Kermani, and Christopher J. Palmer. "How quantitative easing works: Evidence on the refinancing channel." The Review of Economic Studies 87, no. 3 (2020): 1498-1528.
Ehrlich, Gabriel, and Jeffrey Perry. “Do Large-Scale Refinancing Programs Reduce Mortgage Defaults? Evidence from a Regression Discontinuity Design.” SSRN Electronic Journal, 2015. http://dx.doi.org/10.2139/ssrn.2678425.
Feinberg, Robert M., Daniel Kuehn, Signe-Mary McKernan, Doug Wissoker, and Sisi Zhang. "Explaining Variation in Title Charges: A Study of Five Metropolitan Residential Real Estate Markets." Review of Industrial Organization 46 (2015): 145-167.
Fisher, Jack, Alessandro Gavazza, Lu Liu, Tarun Ramadorai, and Jagdish Tripathy. "Refinancing Cross-Subsidies in the Mortgage Market." SSRN Electronic Journal, 2022. http://dx.doi.org/10.2139/ssrn.3962433.
Gerardi, Kristopher, Lara Loewenstein, and Paul S. Willen. "Evaluating the benefits of a streamlined refinance program." Housing Policy Debate 31, no. 1 (2021): 51-65.
Gerardi, Kristopher, Lauren Lambie-Hanson, and Paul Willen. "Racial differences in mortgage refinancing, distress, and housing wealth accumulation during COVID-19." (2021).
Gerardi, Kristopher, Paul S. Willen, and David Hao Zhang. "Mortgage prepayment, race, and monetary policy." Journal of Financial Economics 147, no. 3 (2023): 498-524.
Goodman, Laurie, Bing Bai, and Wei Li. "Real Denial Rates: A Better Way to Look at Who Is Receiving Mortgage Credit." (2018).
Johnson, Eric, Stephan Meier, and Olivier Toubia. "Leaving Money on the Kitchen Table: Exploring sluggish mortgage refinancing using administrative data, surveys, and field experiments." ACR North American Advances (2016).
Mota, Nuno, and Mark Palim. "Barriers to Entry: Closing Costs for First-Time and Low-Income Homebuyers." Washington, DC: Fannie Mae (2021).
Park, Kevin A. "Measuring Risk and Access to Mortgage Credit with New Disclosure Data." The Journal of Structured Finance 26, no. 4 (2021): 53-72.
Parolin, Zachary, and Emma K. Lee. "The role of poverty and racial discrimination in exacerbating the health consequences of COVID-19." The Lancet Regional Health-Americas 7 (2022): 100178.
Popick, Stephen. "Did Minority Applicants Experience Worse Lending Outcomes in the Mortgage Market? A Study Using 2020 Expanded HMDA Data." FDIC Center for Financial Research Paper 2022-05 (2022).
Shirley Zhang, Abigail Sussman, and Christopher K. Hsee, “The Expediting Effect: When Lower Interest Costs Lead to Faster Payment of Debt,” Working paper, February 2019.
Trefzger, Joseph W., and Roger E. Cannaday. "NPV of Refinancing: Rethinking the Borrower's Discount Rate." Journal of Real Estate Practice and Education 18, no. 1 (2015): 1-34.
Zhang, David Hao, and Paul S. Willen. Do Lenders Still Discriminate? A Robust Approach for Assessing Differences in Menus. No. w29142. National Bureau of Economic Research, 2021.
We thank our research team, specifically Minh Phan for his hard work and contribution to this research. Additionally, we thank Elizabeth Ellis, Sarah Figgatt, Annabel Jouard, Stephen Harrington, Kate Finnerty and Clarke Wilson for their support. We are indebted to our internal partners and colleagues, who support delivery of our agenda in a myriad of ways, and acknowledge their contributions to each and all releases.
We are also grateful for the invaluable constructive feedback we received from external experts and partners, including Chen Zhao, Kanav Bhagat, Yingqi Xu, and Andre Perry. We are deeply grateful for their generosity of time, insight, and support.
We would like to acknowledge Jamie Dimon, CEO of JPMorgan Chase & Co., for his vision and leadership in establishing the Institute and enabling the ongoing research agenda. We remain deeply grateful to Tim Berry, Head of Corporate Responsibility, Heather Higginbottom, Head of Research & Policy, and others across the firm for the resources and support to pioneer a new approach to contribute to global economic analysis and insight.
This material is a product of JPMorgan Chase Institute and is provided to you solely for general information purposes. Unless otherwise specifically stated, any views or opinions expressed herein are solely those of the authors listed and may differ from the views and opinions expressed by J.P. Morgan Securities LLC (JPMS) Research Department or other departments or divisions of JPMorgan Chase & Co. or its affiliates. This material is not a product of the Research Department of JPMS. Information has been obtained from sources believed to be reliable, but JPMorgan Chase & Co. or its affiliates and/or subsidiaries (collectively J.P. Morgan) do not warrant its completeness or accuracy. Opinions and estimates constitute our judgment as of the date of this material and are subject to change without notice. No representation or warranty should be made with regard to any computations, graphs, tables, diagrams or commentary in this material, which is provided for illustration/reference purposes only. The data relied on for this report are based on past transactions and may not be indicative of future results. J.P. Morgan assumes no duty to update any information in this material in the event that such information changes. The opinion herein should not be construed as an individual recommendation for any particular client and is not intended as advice or recommendations of particular securities, financial instruments, or strategies for a particular client. This material does not constitute a solicitation or offer in any jurisdiction where such a solicitation is unlawful.
Wheat, Chris, Makada Henry-Nickie, Pascal Noel, and Alexandra Lefevre. 2023. “Measuring the gap: Refinancing trends and disparities during the COVID-19 pandemic.” JPMorgan Chase Institute. https://www.jpmorganchase.com/institute/research/household-debt/measuring-the-gap-refinancing-trends-and-disparities-during-COVID-19


JPMorgan Chase & Co.'s website terms, privacy and security policies don't apply to the site or app you're about to visit. Please review its website terms, privacy and security policies to see how they apply to you. JPMorgan Chase & Co. isn't responsible for (and doesn't provide) any products, services or content at this third-party site or app, except for products and services that explicitly carry the JPMorgan Chase & Co.